Published: 2024-01-16T14:56:43.000Z
Chart AUD/USD Update: Extending late-December losses
-
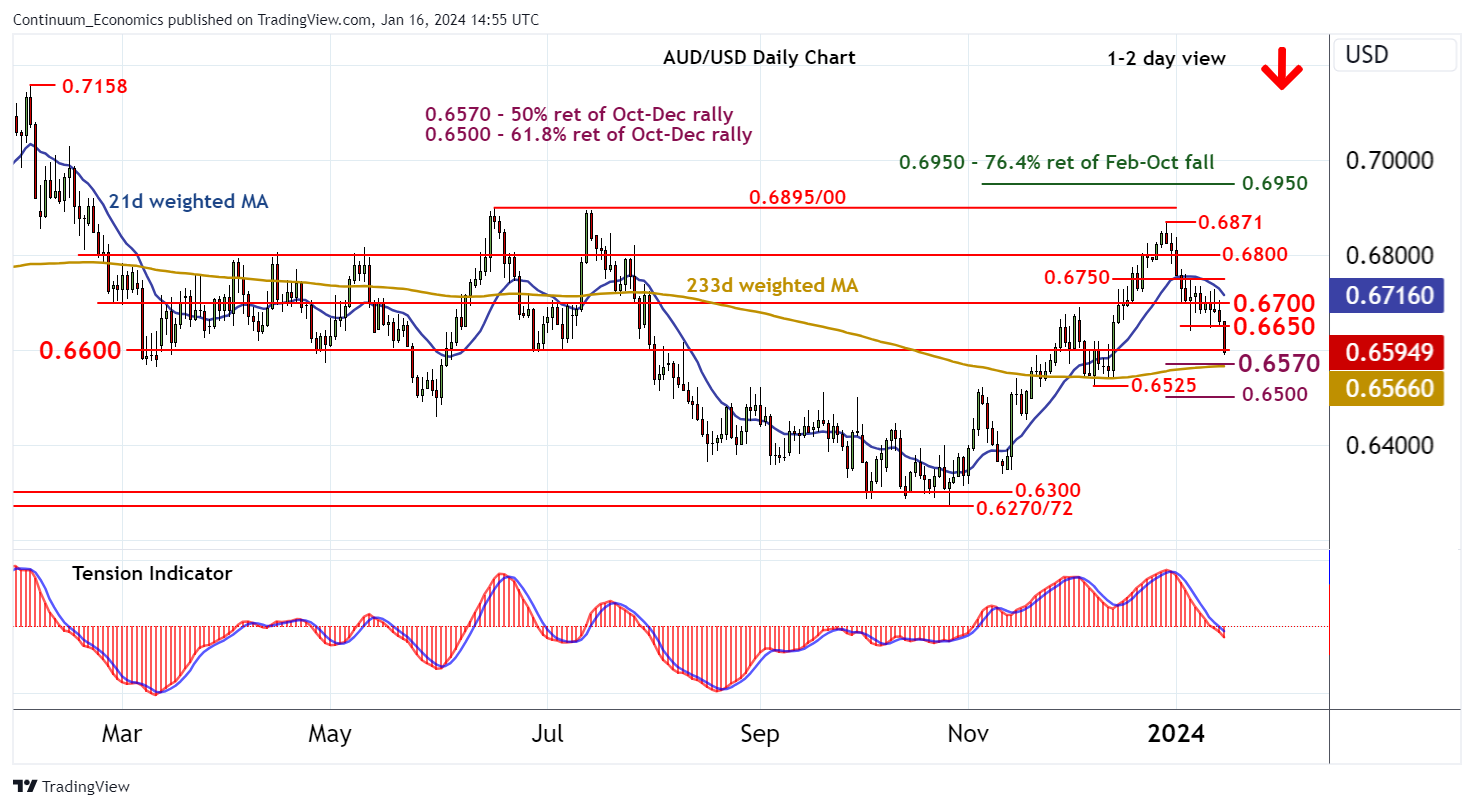
Anticipated losses have reached congestion support at 0.6600
| Levels | Imp | Comment | Levels | Imp | Comment | |||
|---|---|---|---|---|---|---|---|---|
| R4 | 0.6800 | * | congestion | S1 | 0.6600 | * | congestion | |
| R3 | 0.6750 | break level | S2 | 0.6570 | ** | 50% ret of Oct-Dec rally | ||
| R2 | 0.6700 | * | congestion | S3 | 0.6525 | ** | 7 Dec (m) low | |
| R1 | 0.6650 | * | break level | S4 | 0.6500 | ** | cong, 61.8% ret |
Asterisk denotes strength of level
14:50 GMT - Anticipated losses have reached congestion support at 0.6600. Just beneath here is the 0.66570 Fibonacci retracement, but already oversold intraday studies could limit initial tests of here in consolidation, before negative daily readings and deteriorating weekly charts prompt a break. A later close below 0.6570 will add fresh weight to already negative sentiment and extend late-December losses towards the 0.6525 monthly low of 7 December. Meanwhile, resistance is lowered to 0.6650. An unexpected close above here will turn sentiment neutral and prompt consolidation beneath congestion resistance at 0.6700.