Published: 2026-07-28T01:48:10.000Z
Chart GBP/USD Update: Extending losses
4
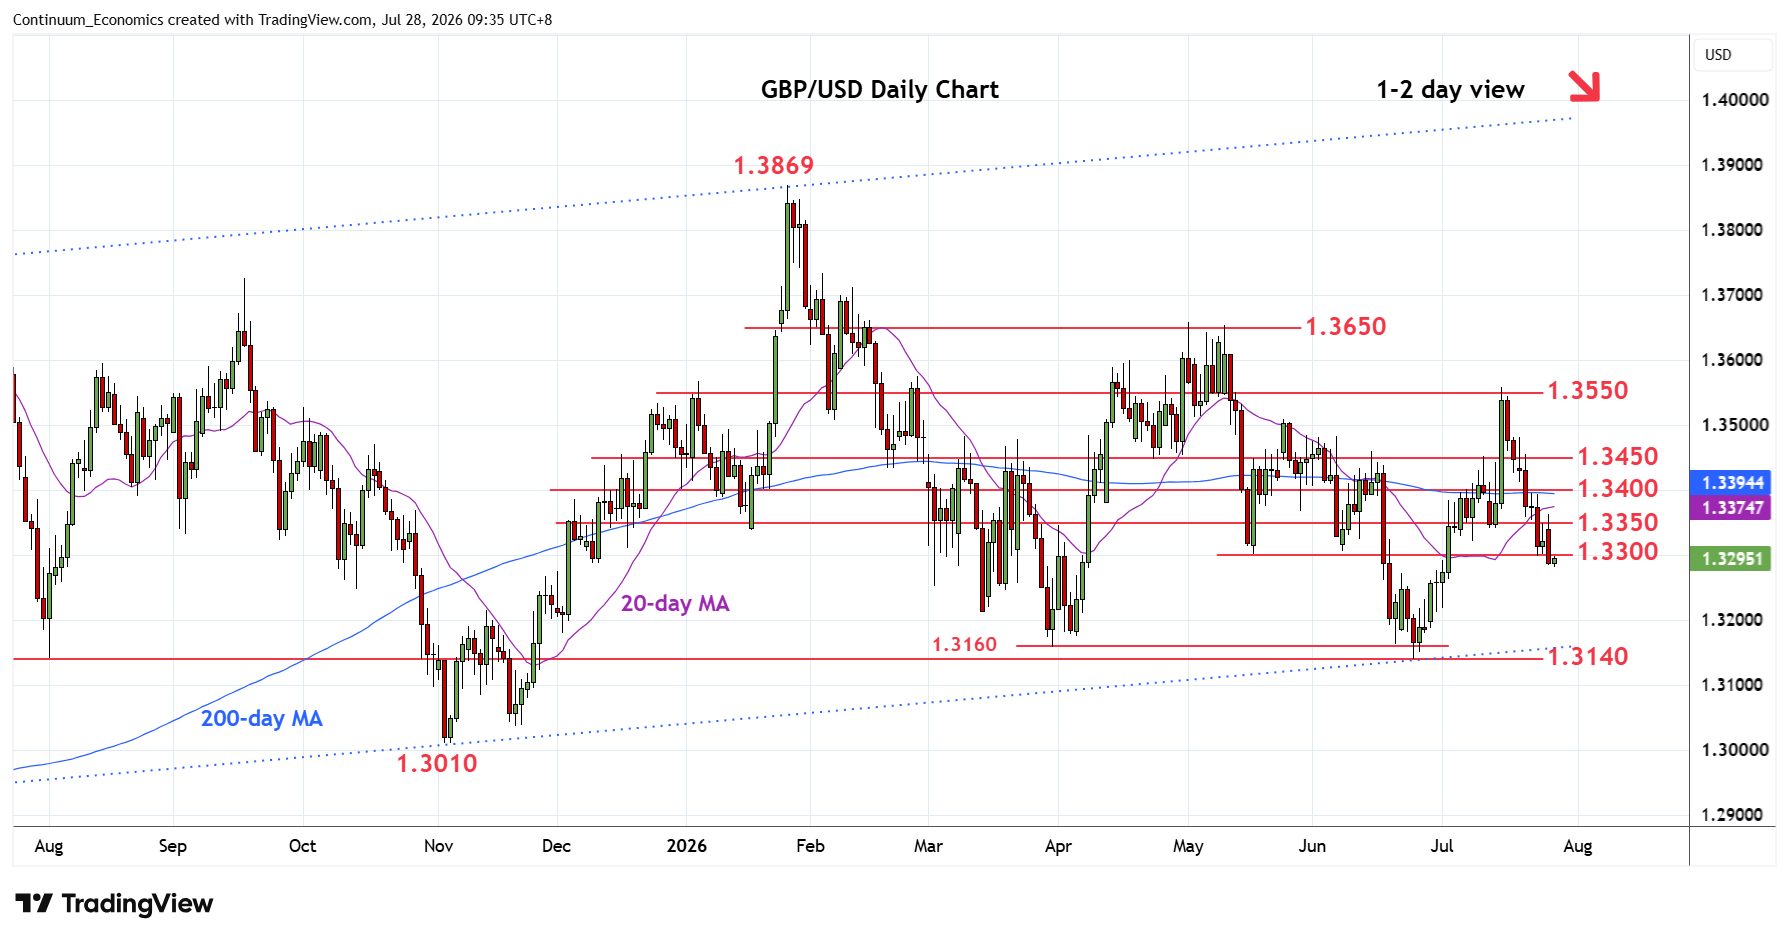
Under pressure, as break of the 1.3300 support see prices extending losses from the 1.3558, mid-July swing high
| Level | Comment | Level | Comment | |||||
|---|---|---|---|---|---|---|---|---|
| R4 | 1.3500 | * | congestion | S1 | 1.3250 | * | congestion | |
| R3 | 1.3450 | ** | congestion | S2 | 1.3200 | * | congestion | |
| R2 | 1.3400 | * | congestion | S3 | 1.3140 | ** | 24 Jun YTD low | |
| R1 | 1.3350 | * | congestion | S4 | 1.3100 | * | congestion |
Asterisk denotes strength of level
01:40 GMT - Under pressure, as break of the 1.3300 support see prices extending losses from the 1.3558, mid-July swing high. Daily studies are oversold but the negative weekly studies suggest consolidation at 1.3282 low giving way to renewed selling pressure later. Lower will see room for extension to the 1.3250 congestion and 1.3200 level. Lower still, will return focus to the 1.3160/40, late-March and the June current year lows. Meanwhile, resistance at the 1.3300/1.3350 area now expected to cap and sustain losses from the mid-July high.