Published: 2026-06-29T02:01:33.000Z
Chart GBP/USD Update: Consolidating above 1.3140 current year low
1
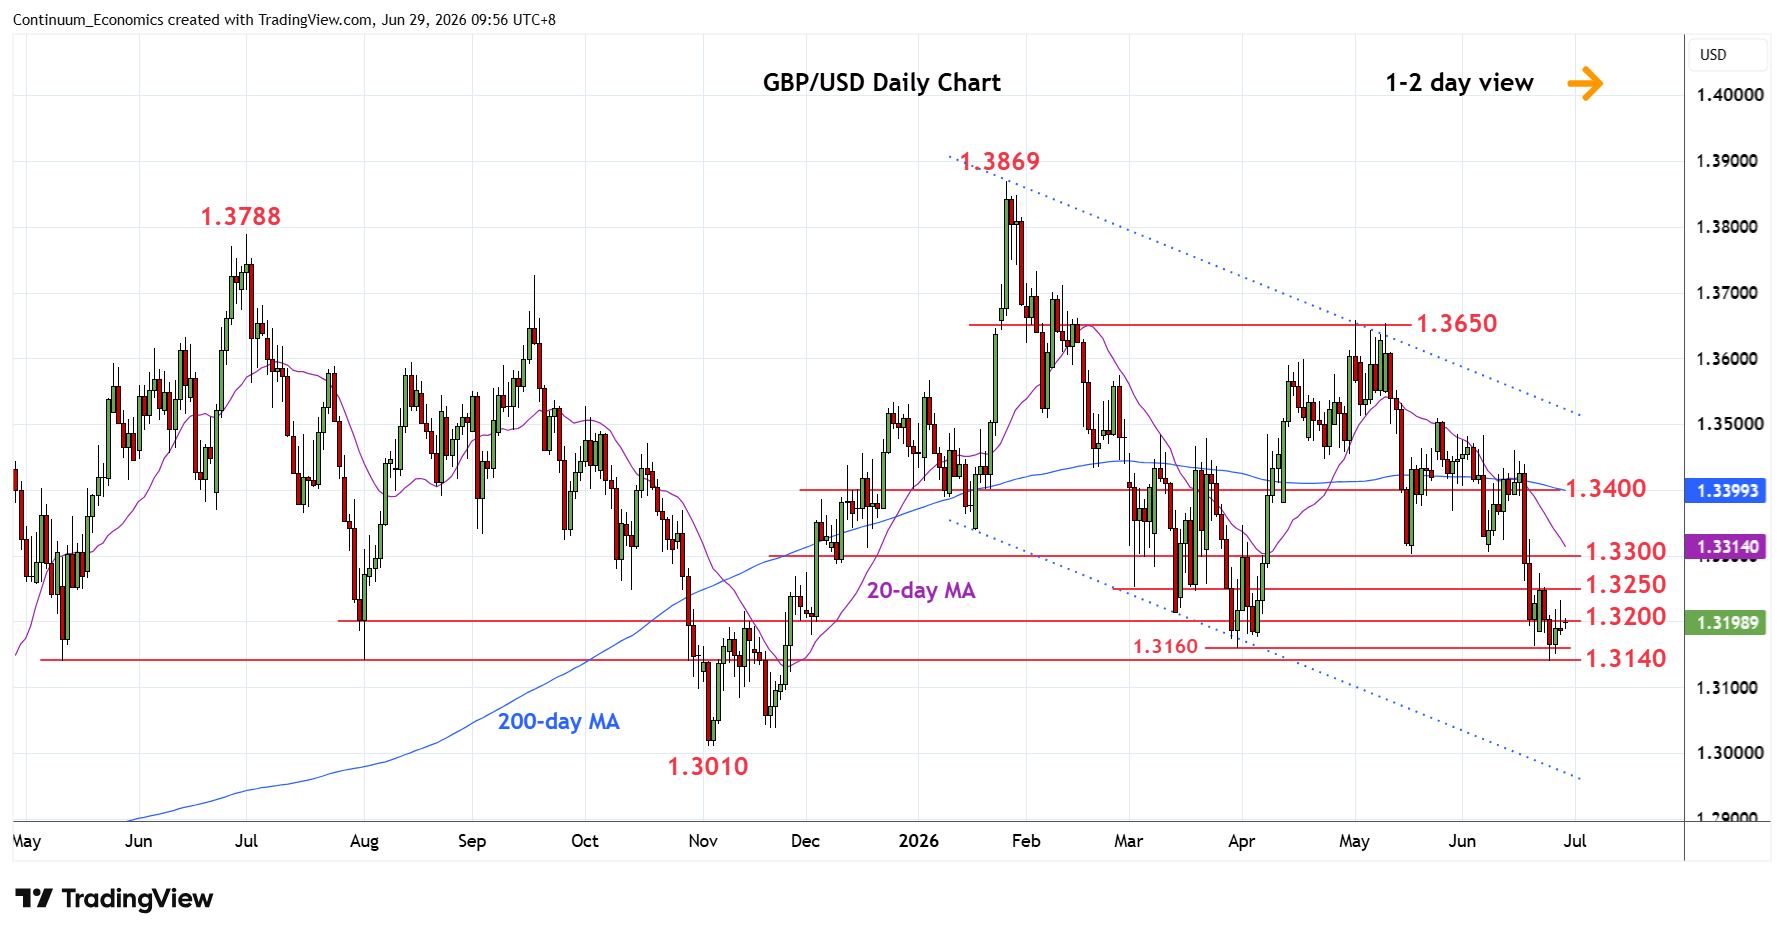
Little change, as prices extend consolidation at the 1.3200 level following bounce from the 1.3160/40 support
| Level | Comment | Level | Comment | |||||
|---|---|---|---|---|---|---|---|---|
| R4 | 1.3400 | * | congestion | S1 | 1.3160 | * | Mar low | |
| R3 | 1.3350 | congestion | S2 | 1.3140 | ** | 24 Jun YTD low | ||
| R2 | 1.3300 | ** | congestion, May low | S3 | 1.3100 | * | congestion | |
| R1 | 1.3200/50 | * | congestion | S4 | 1.3010 | ** | 4 Nov low |
Asterisk denotes strength of level
02:00 GMT - Little change, as prices extend consolidation at the 1.3200 level following bounce from the 1.3160/40 support and 24 June current year low. Daily studies have turned up from oversold areas and suggest scope for corrective bounce to resistance at 1.3250 congestion. Above here will open up room to strong resistance at the 1.3300 May low. Meanwhile, support at the 1.3140 low should underpin. Break here will see room to further extend the January losses to 1.3100 congestion. Lower still, if seen, will turn focus to 1.3010, November low.