Published: 2026-09-21T00:35:39.000Z
Chart NZD/USD Update: Consolidating above .5700, but still heavy
3
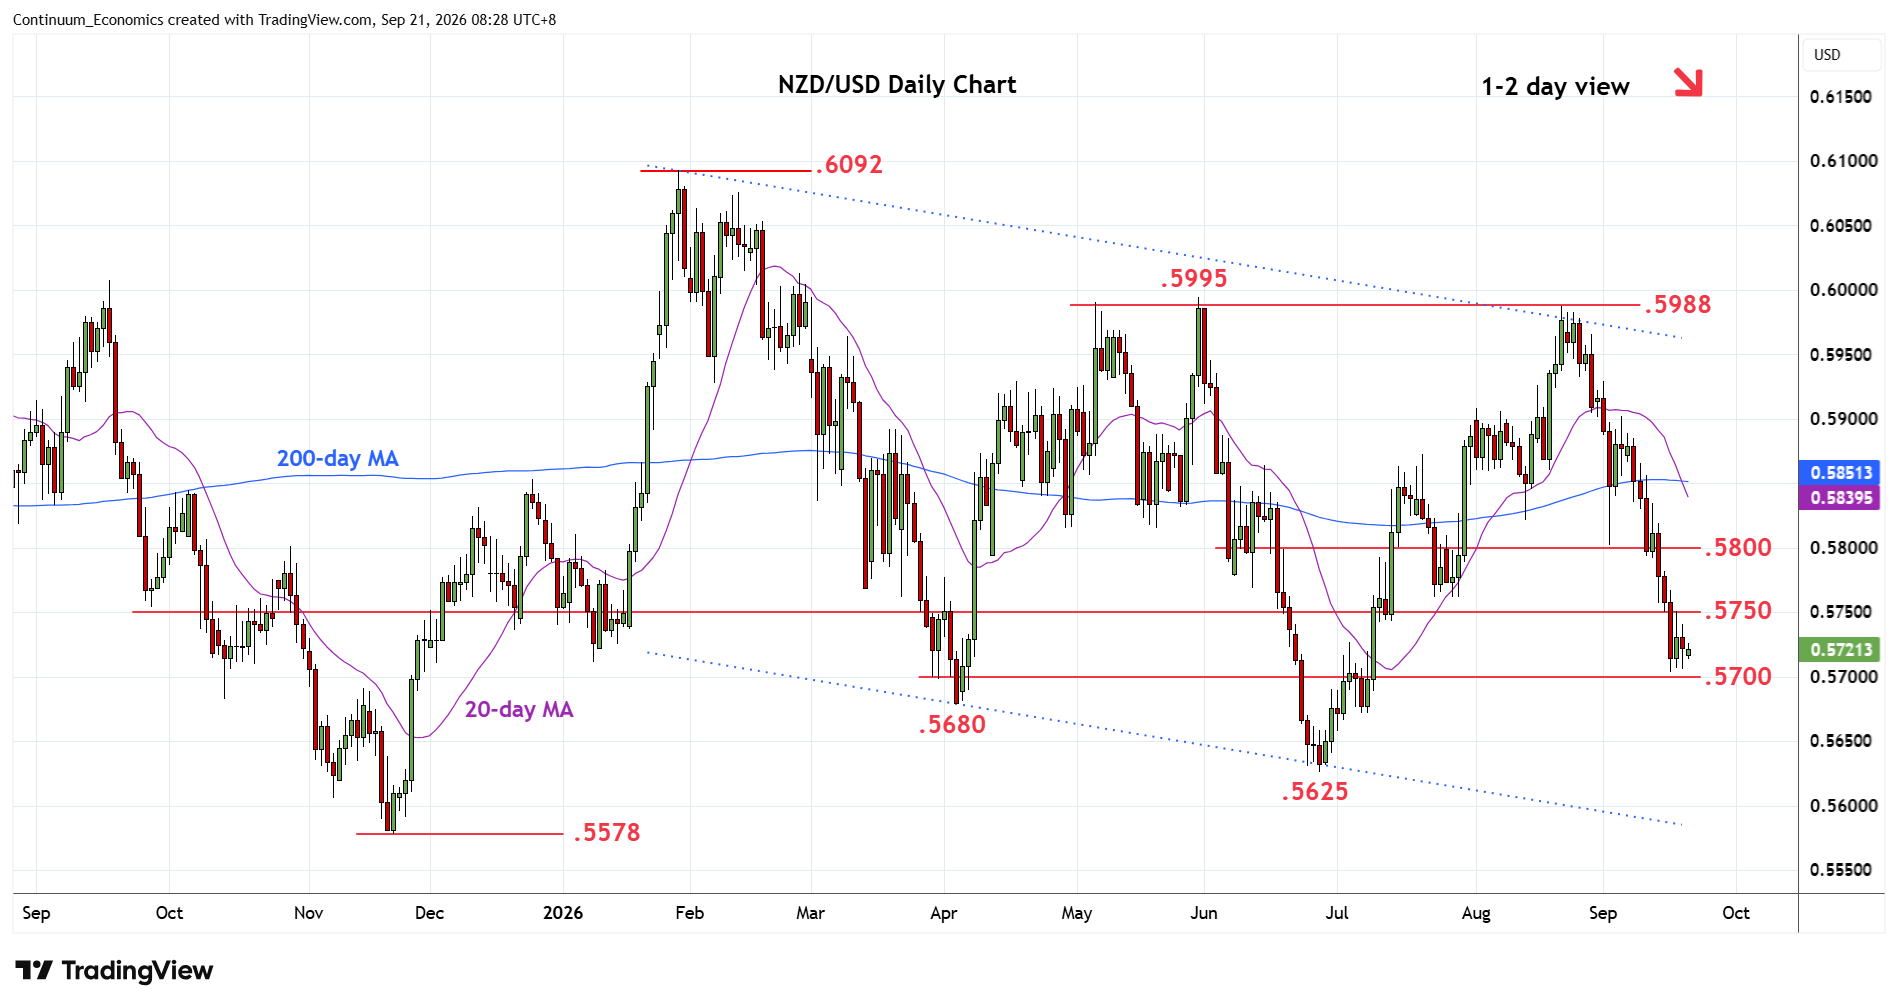
Little change, as prices extend consolidation above the .5700 support
| Levels | Imp | Comment | Levels | Imp | Comment | |||
|---|---|---|---|---|---|---|---|---|
| R4 | .5900 | ** | congestion, 4 Sep high | S1 | .5700 | * | congestion | |
| R3 | .5850 | * | congestion, 200-day MA | S2 | .5680 | ** | Apr low | |
| R2 | .5800 | ** | congestion | S3 | .5650 | * | congestion | |
| R1 | .5750 | * | congestion | S4 | .5625 | ** | 26 Jun YTD low |
Asterisk denotes strength of level
00:30 GMT - Little change, as prices extend consolidation above the .5700 support. The resulting flag pattern suggest scope for later break here to extend losses from the .5900 level. Lower will see room to the .5680 support then the .5625 June current year low. Meanwhile, resistance is at the the .5750 congestion and this extend to the .5765 high of 16 September. Would take break here to ease the downside pressure and open up room to strong resistance at .5800 level which is expected to cap. Above here will revive upside focus and see stronger gains to retrace losses from .5988, August high.