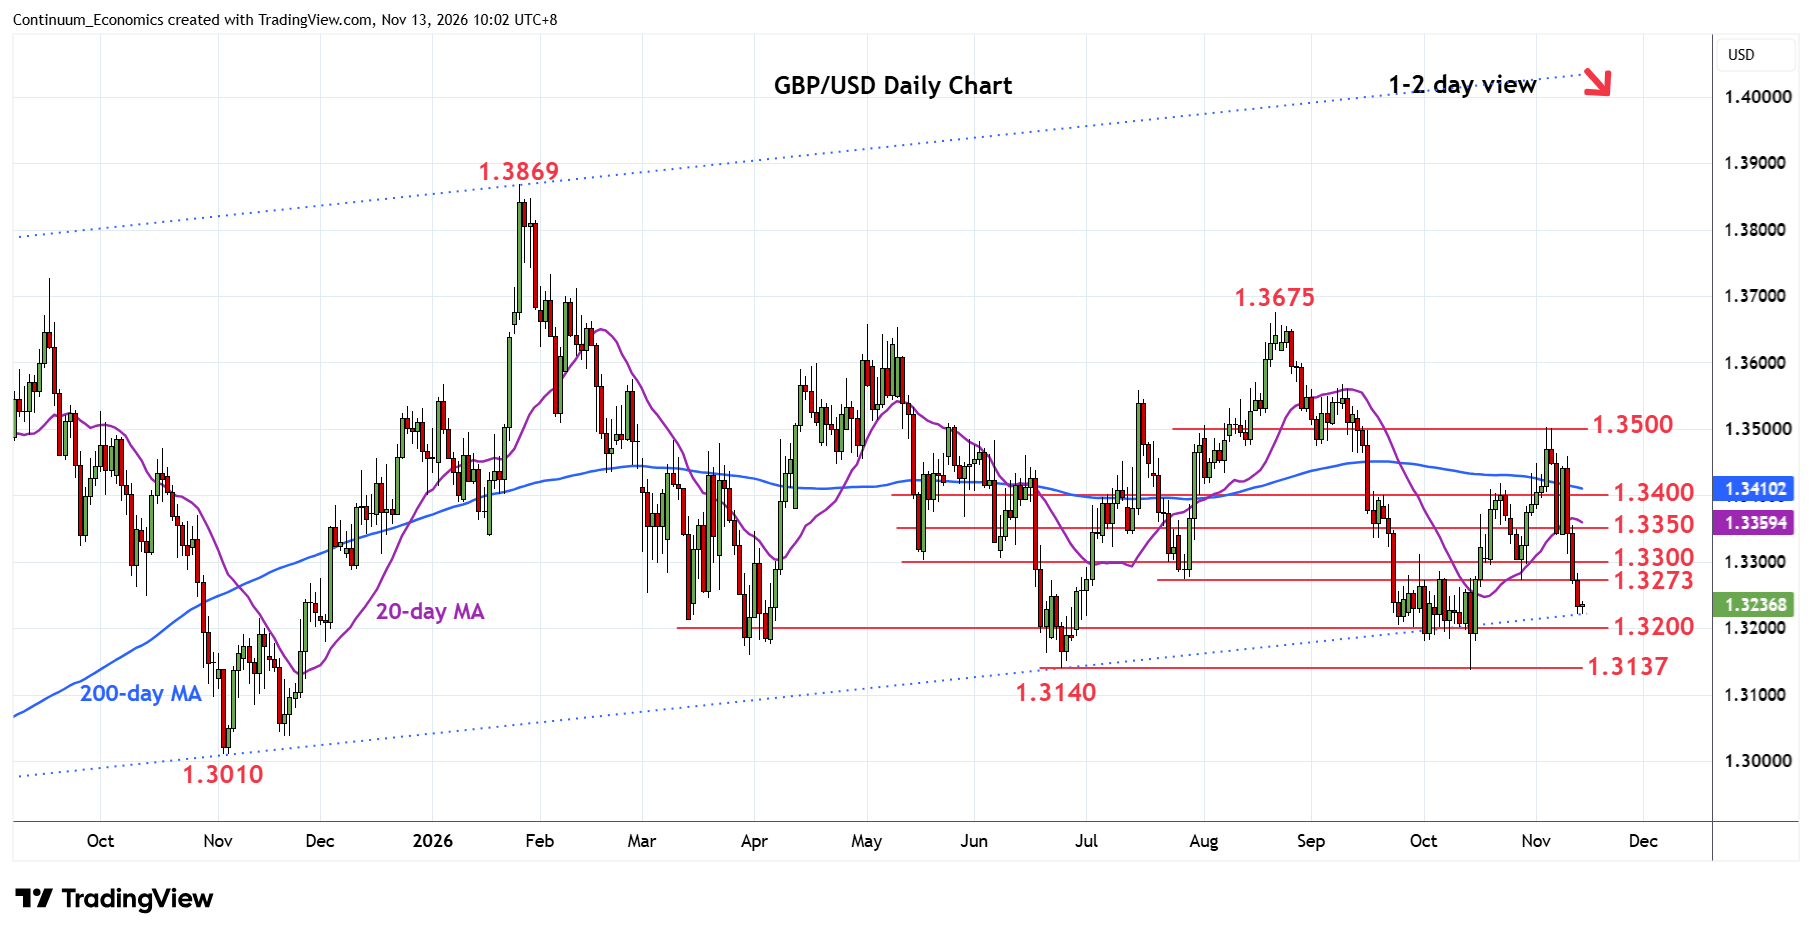
Chart GBP/USD Update: Consolidating at 1.3220 low, further losses later
Break of the strong support at the 1.3300/1.3273 area see prices extending losses from the 4 November swing high to reach 1.3220 low
| Level | Comment | Level | Comment | |||||
|---|---|---|---|---|---|---|---|---|
| R4 | 1.3400 | ** | congestion | S1 | 1.3200 | * | congestion | |
| R3 | 1.3350 | * | congestion | S2 | 1.3150 | * | congestion | |
| R2 | 1.3300 | ** | congestion | S3 | 1.3140/37 | ** | Jun/14 Oct YTD lows | |
| R1 | 1.3273 | * | 28 Jul low | S4 | 1.3100 | * | congestion |
Asterisk denotes strength of level
02:00 GMT - Break of the strong support at the 1.3300/1.3273 area see prices extending losses from the 4 November swing high to reach 1.3220 low. Consolidation here see prices unwinding oversold intraday studies but pressure remains on the downside and lower will see room to the 1.3200 congestion. Below this will turn focus to the 1.3140/1.3137, June low and October current year low. Meanwhile, resistance is lowered to the 1.3273/1.3300 area which is expected to cap corrective bounce. Above here will fade the downside pressure and see room for stronger bounce to retrace losses from the 1.3500 high.