Weekly Chart GBP/USD Update: Consolidating losses - studies under pressure
Anticipated losses have broken below 1.3400 to reach support at the 1.3345 Fibonacci retracement
Anticipated losses have broken below 1.3400 to reach support at the 1.3345 Fibonacci retracement.
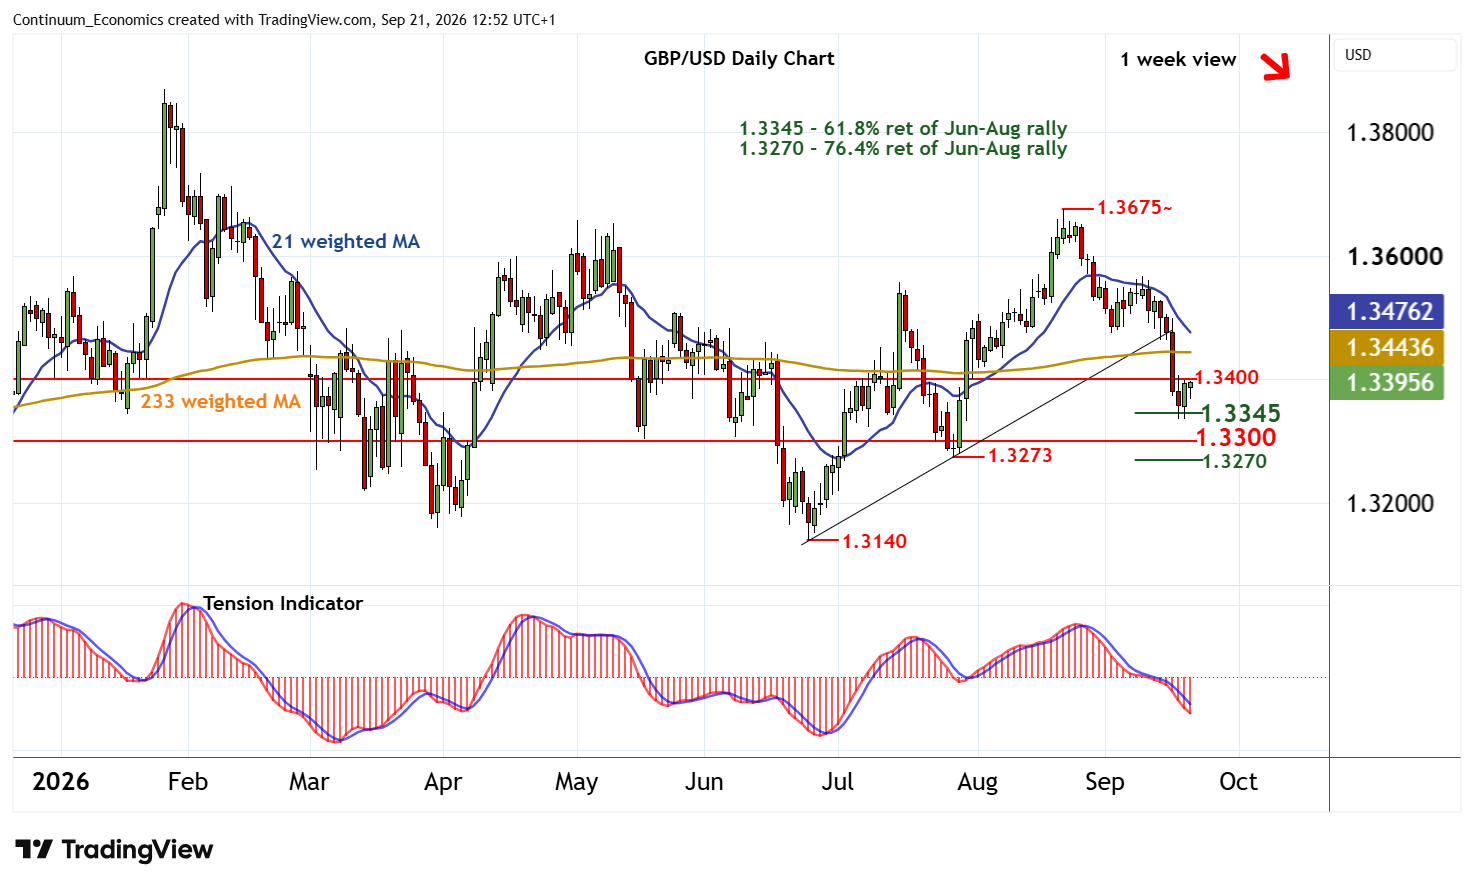
Oversold daily stochastics are flattening, suggesting potential for consolidation above here, before the bearish daily Tension Indicator and deteriorating weekly charts prompt further losses.
A later close beneath here will add weight to sentiment and further extend losses from the 1.3675~ current year high of 21 August towards congestion around 1.3300. Just lower is the 1.3270 retracement. But already oversold daily stochastics could limit any initial tests of this range in short-covering/consolidation.
Meanwhile, resistance is lowered to congestion around 1.3500.
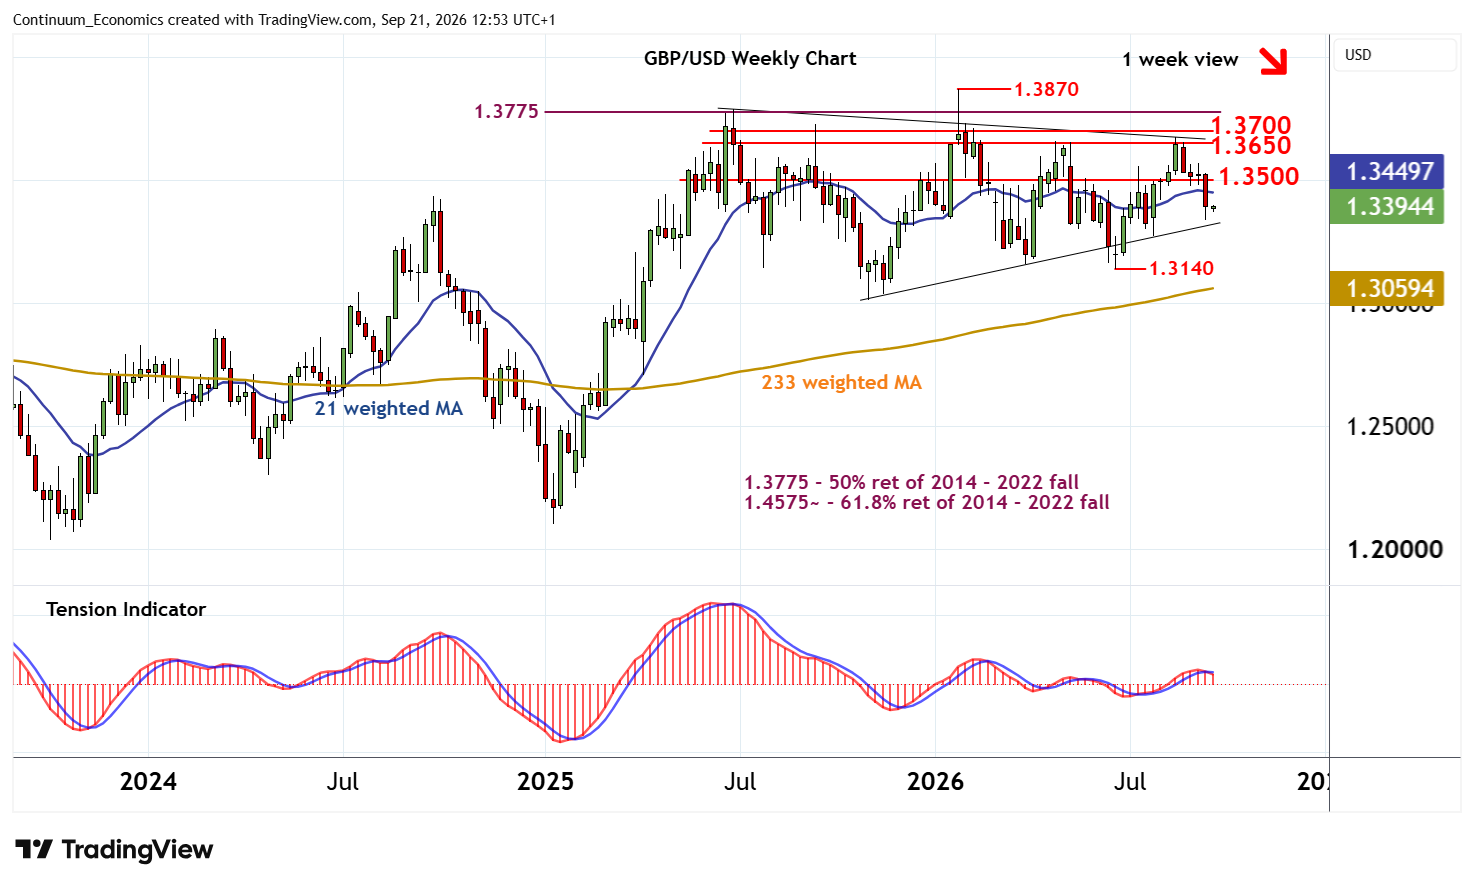
Bearish weekly charts should limit any corrective bounce in renewed selling interest beneath here. A close above 1.3500, however, will help to stabilise price action and prompt fresh consolidation within multi-month congestion beneath 1.3650 and 1.3700 and extend the multi-month pennant from June 2025.