Published: 2026-06-16T08:11:44.000Z
Chart USD Index DXY Update: Consolidating - daily studies under pressure
4
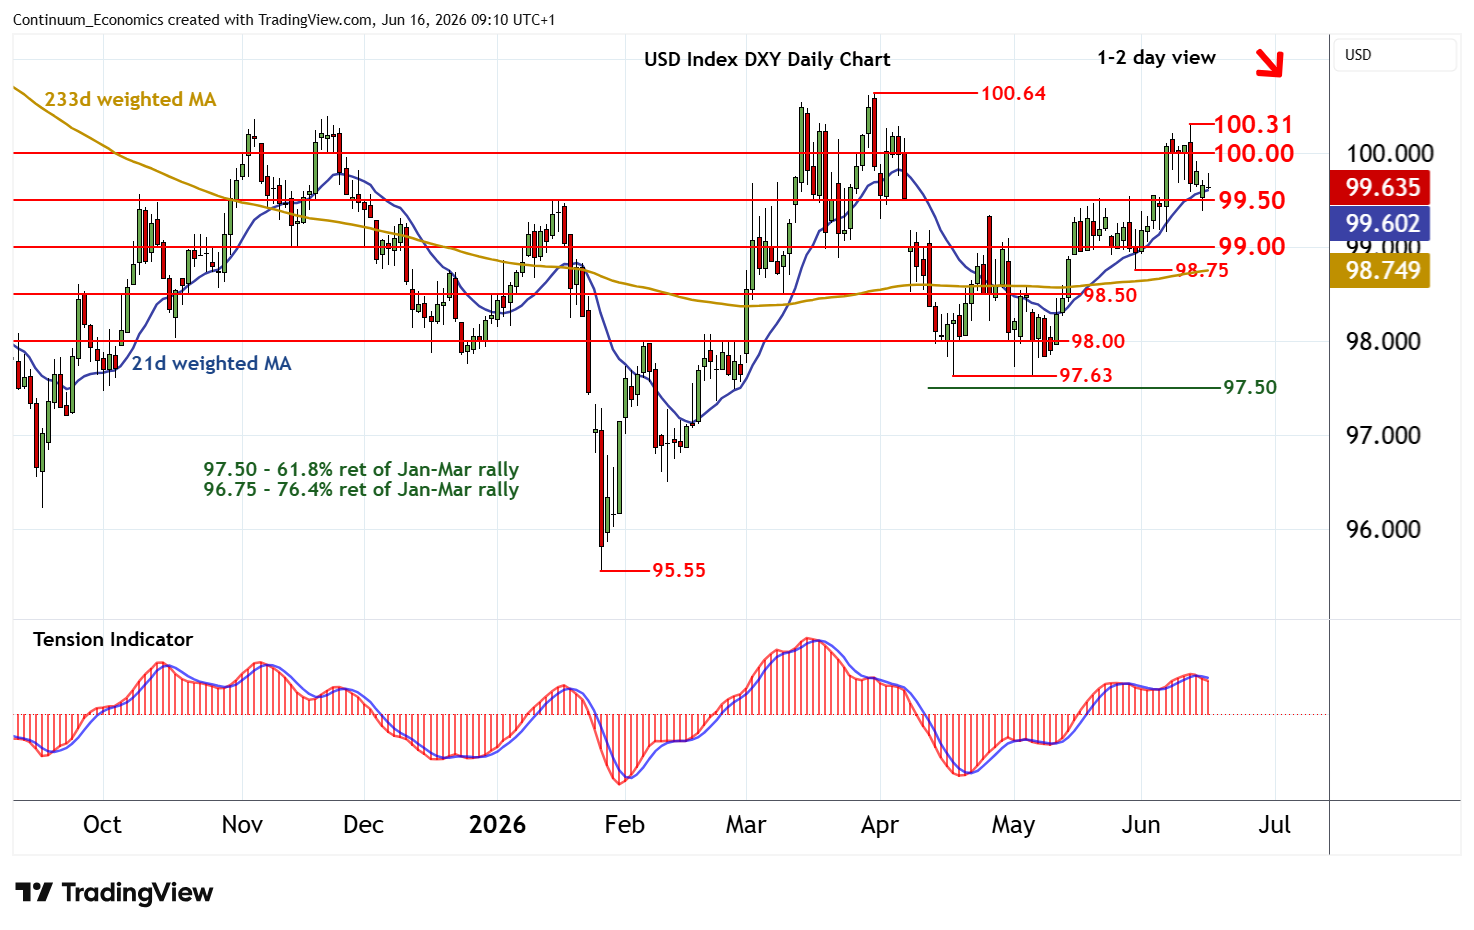
The anticipated break below congestion support at 99.50 has proven short-lived
| Levels | Imp | Comment | Levels | Imp | Comment | |||
|---|---|---|---|---|---|---|---|---|
| R4 | 101.15 | ** | 38.2% ret of 2025-2026 fall | S1 | 99.50 | * | congestion | |
| R3 | 100.64 | ** | 31 Mar YTD high | S2 | 99.00 | * | congestion | |
| R2 | 100.31 | ** | 11 Jun (w) high | S3 | 98.75 | 29 May (w) low | ||
| R1 | 100.00 | ** | congestion | S4 | 98.50 | * | congestion |
Asterisk denotes strength of level
09:00 BST - The anticipated break below congestion support at 99.50 has proven short-lived, with prices bouncing from 99.38 back into consolidation above 99.50. Daily stochastics and the daily Tension Indicator continue to track lower, highlighting room for a later break back below 99.50. However, mixed/positive weekly charts should limit initial scope in renewed consolidation above further congestion around 99.00. Meanwhile, resistance remains at congestion around 100.00 and extends to the 100.31 weekly high of 11 June. This range should cap any immediate tests higher.