Published: 2026-07-02T00:42:54.000Z
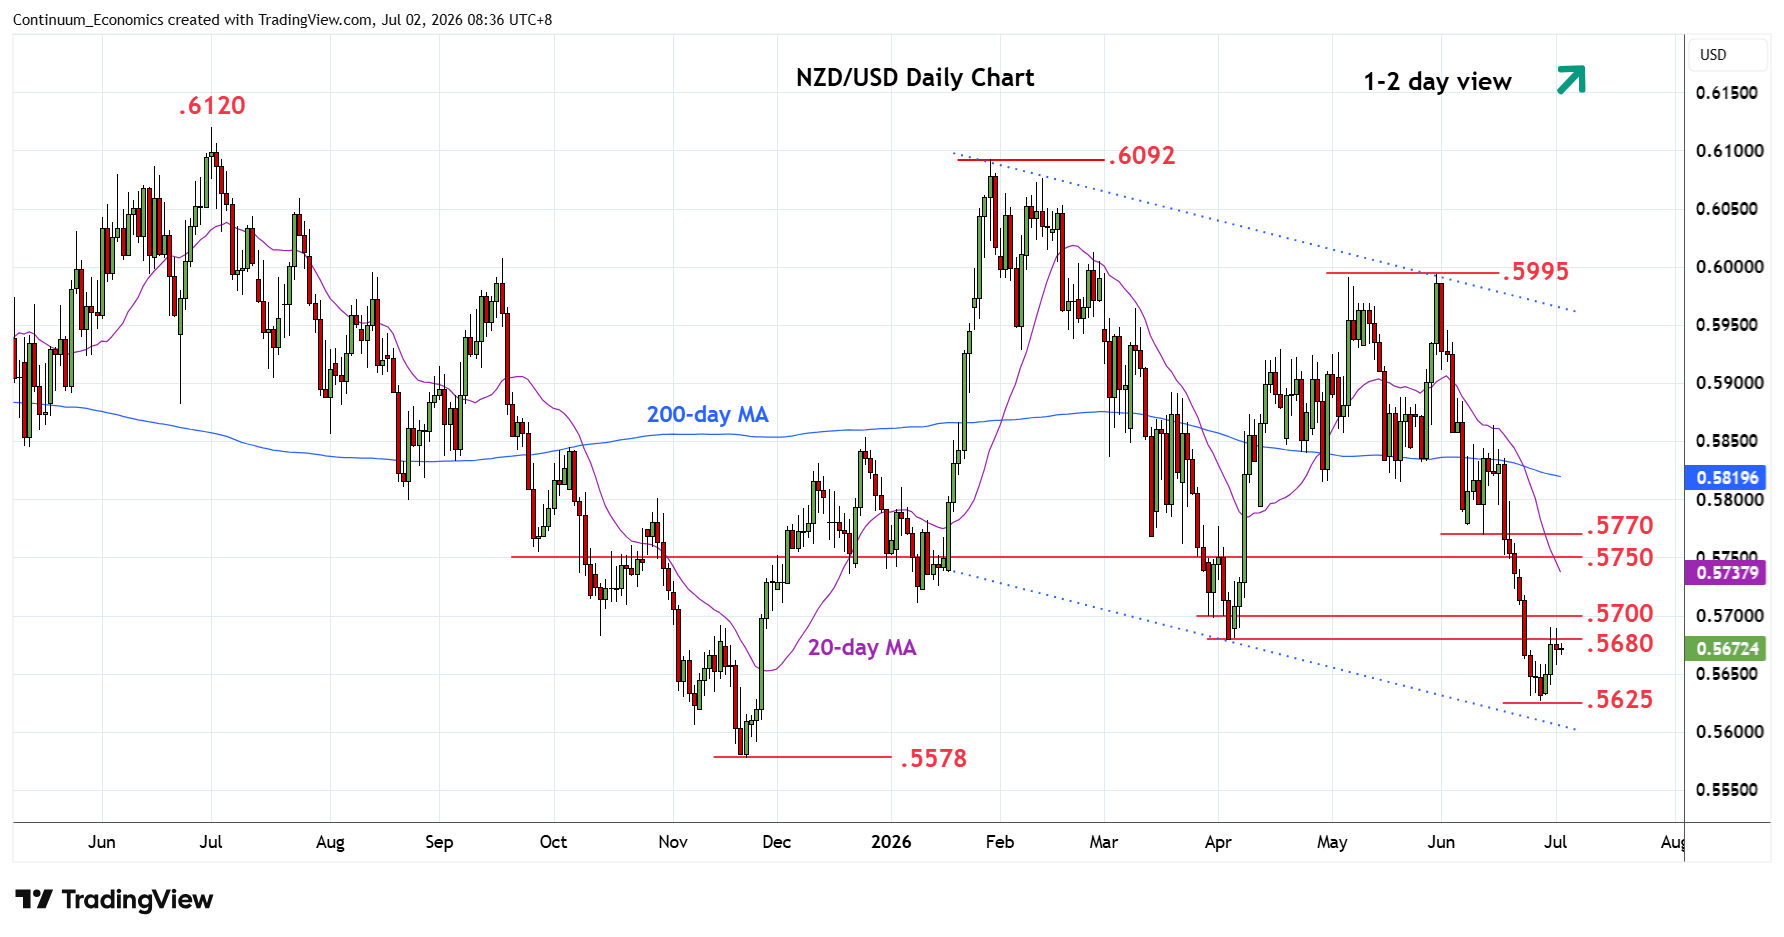
Chart NZD/USD Update: Consolidating test of .5680/.5700 resistance
1
Little change, as prices settled back in range from test of strong resistance at the .5680/.5700 area
| Levels | Imp | Comment | Levels | Imp | Comment | |||
|---|---|---|---|---|---|---|---|---|
| R4 | .5770/80 | ** | 11, 8 Jun lows | S1 | .5625 | ** | 26 Jun YTD low | |
| R3 | .5750 | * | congestion | S2 | .5600 | * | channel, congestion | |
| R2 | .5700 | * | congestion | S3 | .5578 | ** | Nov low | |
| R1 | .5680 | ** | Apr low | S4 | .5550 | congestion |
Asterisk denotes strength of level
00:35 GMT - Little change, as prices settled back in range from test of strong resistance at the .5680/.5700 area. Daily studies have turned up from oversold areas and suggest scope for stronger gains to retrace losses from the May high. Above the .5700 level will open up room for stronger recovery to the .5750 congestion then the .5770/80 area. Meanwhile, support at the .5650/25 area should underpin. Failure here, will extend the January losses and see room support at at the .5600 level and .5578, November low.