Weekly Chart USD/JPY Update: Consolidating test of 155.22/00 support
Gains from the 155.22 low reached strong resistance at the 160.00/160.50 area before giving way to sharp selling pressure to retrace all of the August gains.
Gains from the 155.22 low reached strong resistance at the 160.00/160.50 area before giving way to sharp selling pressure to retrace all of the August gains.
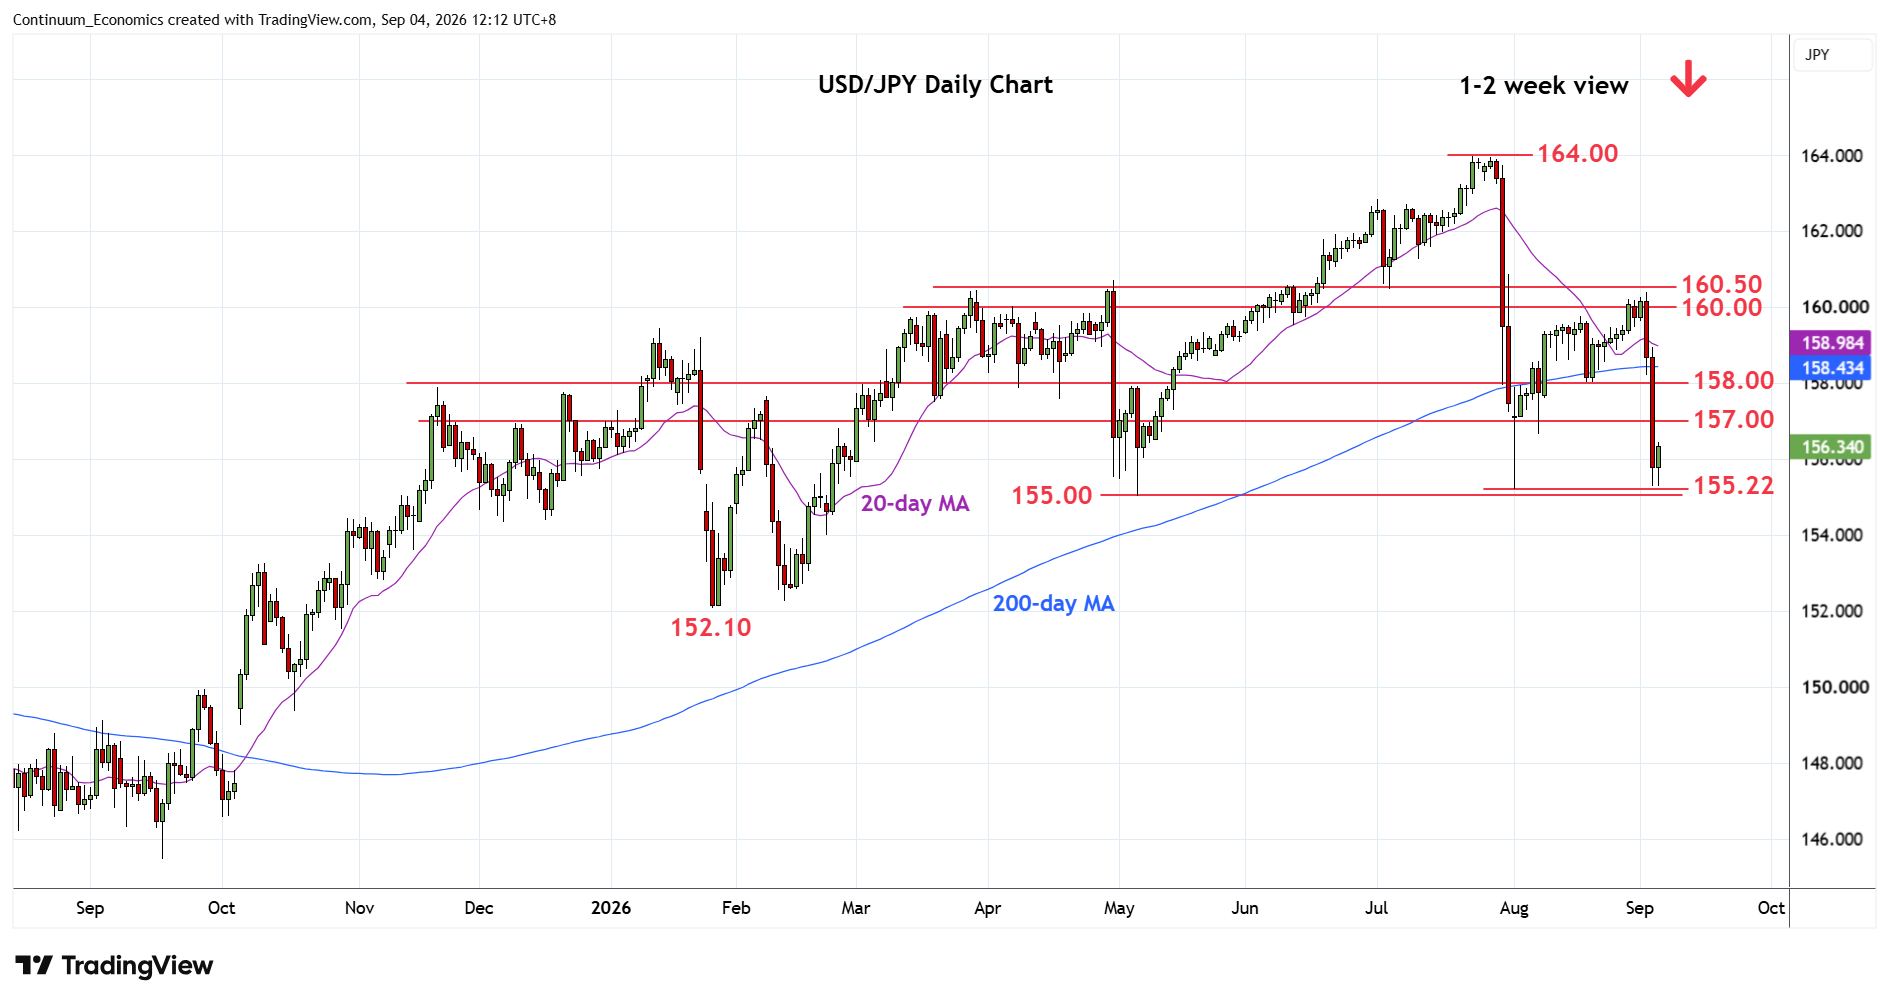
Prices has since turned up from the 155.22/155.00 support to consolidate rejection from the 160.40 high. However, bearish daily and weekly studies highlights risk for further losses ahead to retrace gains from the April 2025 year low. Nearby will see room to 154.85, 38.2% Fibonacci retracement. Lower still, will turn focus to support at the 154.00 congestion but potential will be for extension to strong support at the 152.10/00, January current year low and 2022/2023 year highs.
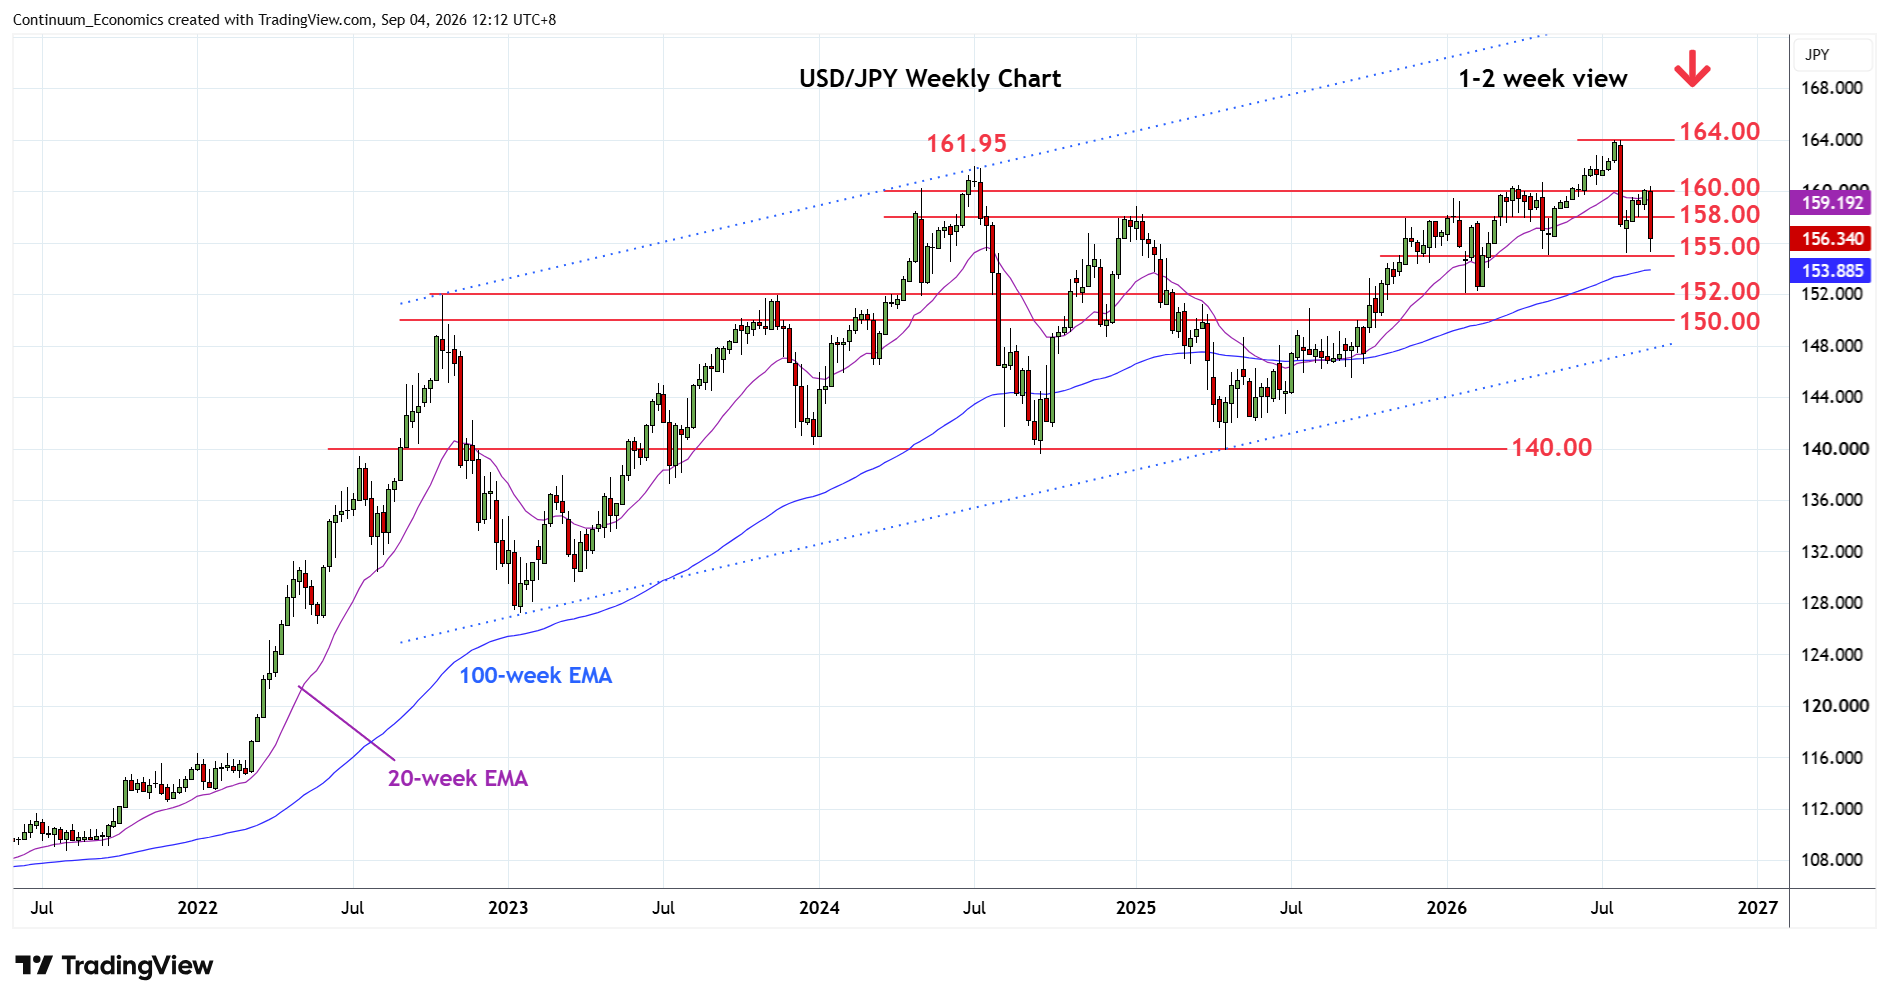
Meanwhile, resistance is lowered to the 157.00/158.00 congestion area and 20 August low which is expected to cap and sustain losses from the 160.00/160.50 resistance zone.