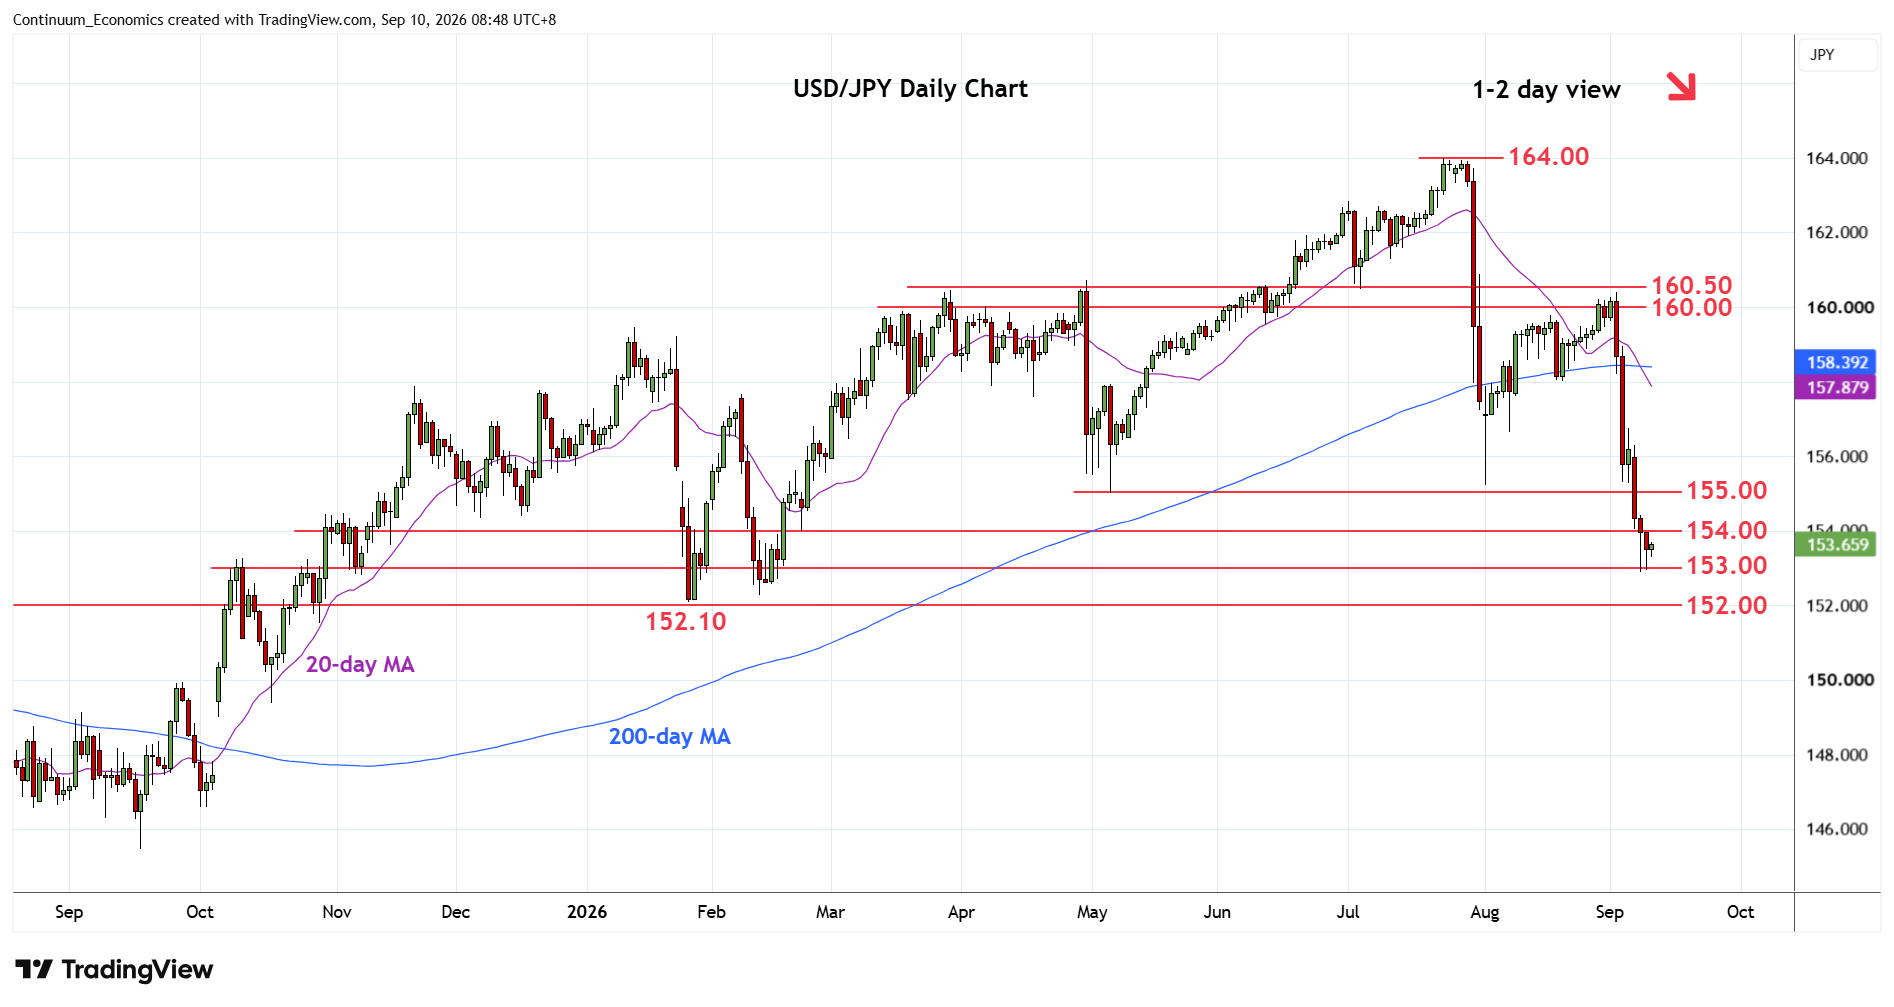
Chart USD/JPY Update: Consolidating test of 153.00
Turned up from test of the 153.00 level as prices consolidate sharp losses from the 160.00 level and unwind oversold intraday studies
| Levels | Imp | Comment | Levels | Imp | Comment | |||
|---|---|---|---|---|---|---|---|---|
| R4 | 157.00 | * | congestion | S1 | 153.00 | * | congestion | |
| R3 | 156.00 | * | congestion | S2 | 152.10 | ** | 27 Jan YTD low | |
| R2 | 155.00/22 | ** | May, Aug lows | S3 | 152.00 | ** | 50% 2025/2026 rally | |
| R1 | 154.00 | * | congestion | S4 | 150.92 | * | Aug 2025 high |
Asterisk denotes strength of level
00:50 GMT - Turned up from test of the 153.00 level as prices consolidate sharp losses from the 160.00 level and unwind oversold intraday studies. The daily studies are stretched as well but pressure on the downside and consolidation expected to give way to further losses later. Below the 153.00 level will turn focus to the June current year low at 152.10 then the 152.00, 50% Fibonacci level as well as 2022/2023 year highs. Would expect test here to give way to consolidation. Meanwhile, resistance is lowered to 154.00. Lift over this will see room to strong resistance at 155.00/155.22, May/August lows, which should cap corrective bounce.