Published: 2026-06-18T00:57:00.000Z
Chart USD/JPY Update: Edging to fresh high
-
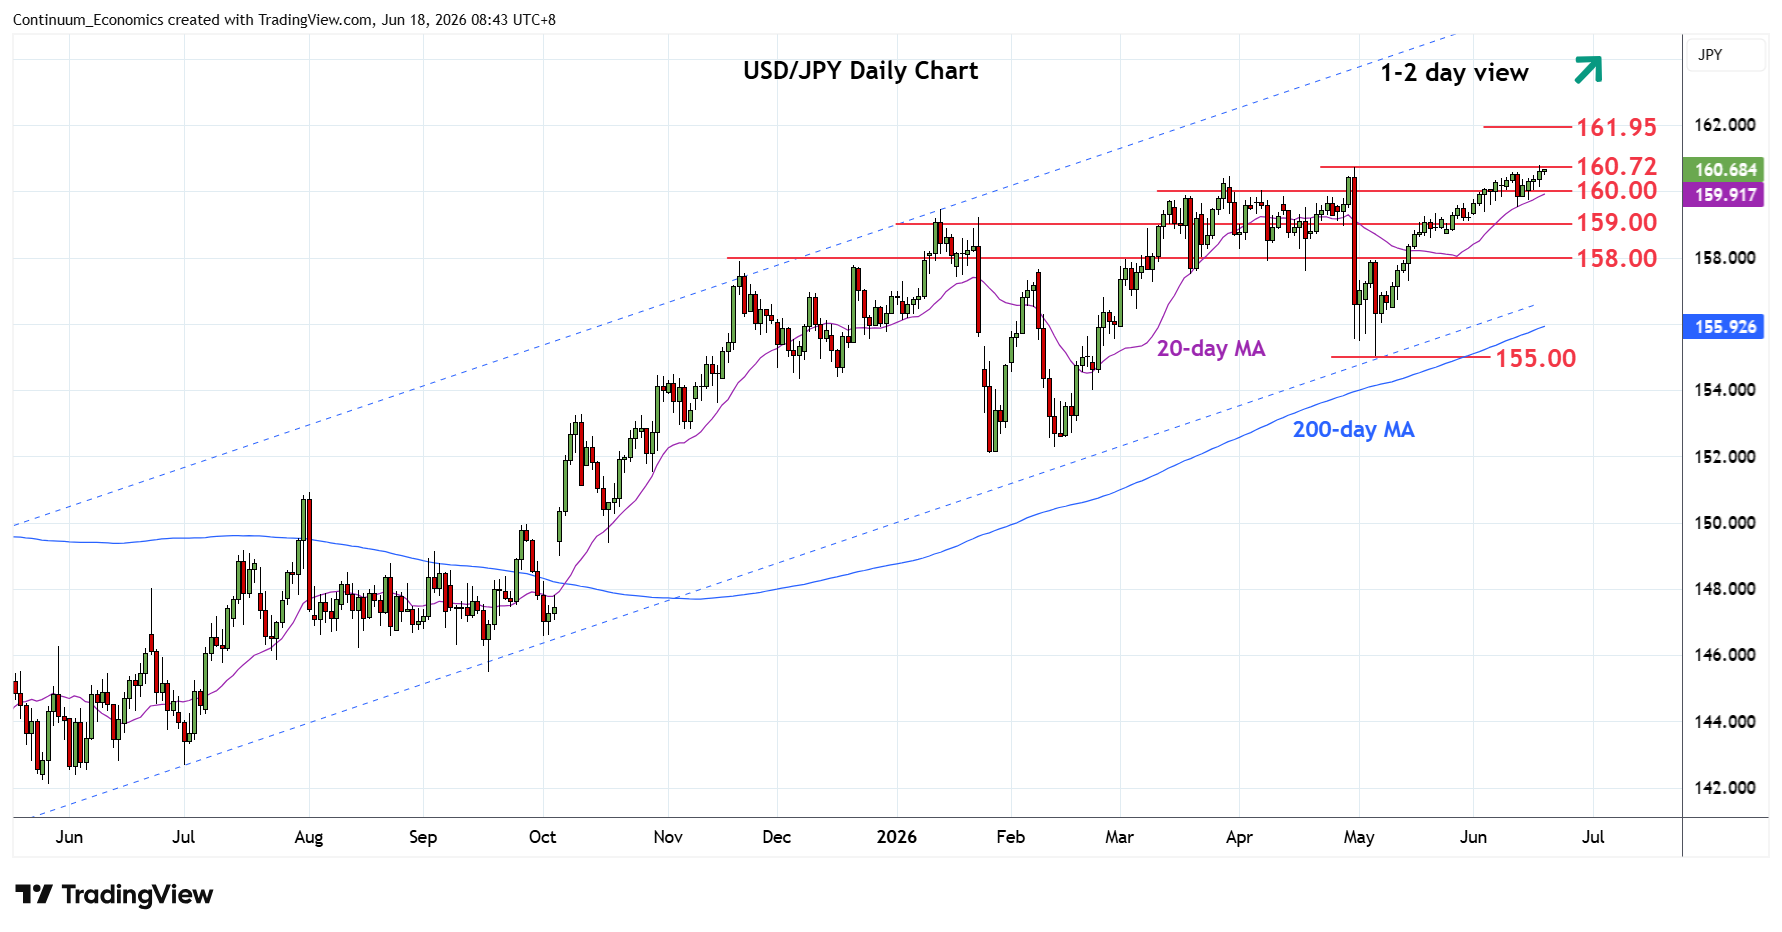
Still pressuring the upside as prices extend bullish gains from the 155.00 May low to retest 160.72 April YTD high
| Levels | Imp | Comment | Levels | Imp | Comment | |||
|---|---|---|---|---|---|---|---|---|
| R4 | 163.00 | * | congestion Dec 1986 | S1 | 160.00 | * | figure | |
| R3 | 161.95 | ** | Jul 2024 multi-year high | S2 | 159.53 | * | 11 Jun low | |
| R2 | 161.00 | * | figure | S3 | 159.00 | * | congestion | |
| R1 | 160.72 | ** | 30 Apr YTD high | S4 | 158.00 | ** | congestion |
Asterisk denotes strength of level
00:50 GMT - Still pressuring the upside as prices extend bullish gains from the 155.00 May low to retest 160.72 April YTD high. Break here will extend the broader gains from 2024 year low and see room to 161.00 level though focus will turn towards the 161.95, July 2024 multi-year high. Meanwhile, support is raised to the 160.00 figure and this extend to the 159.53 low of last week. Would take break here to open up room for deeper pullback to retrace strong gains from the 155.00 May low. Lower will see room to support at the 159.00/158.60 congestion and 18 May low.