Chart EUR/NOK Update: Extending gains in NOK-driven trade
Anticipated gains from the 10.2450 current year low of 30 October are extending in NOK-driven trade
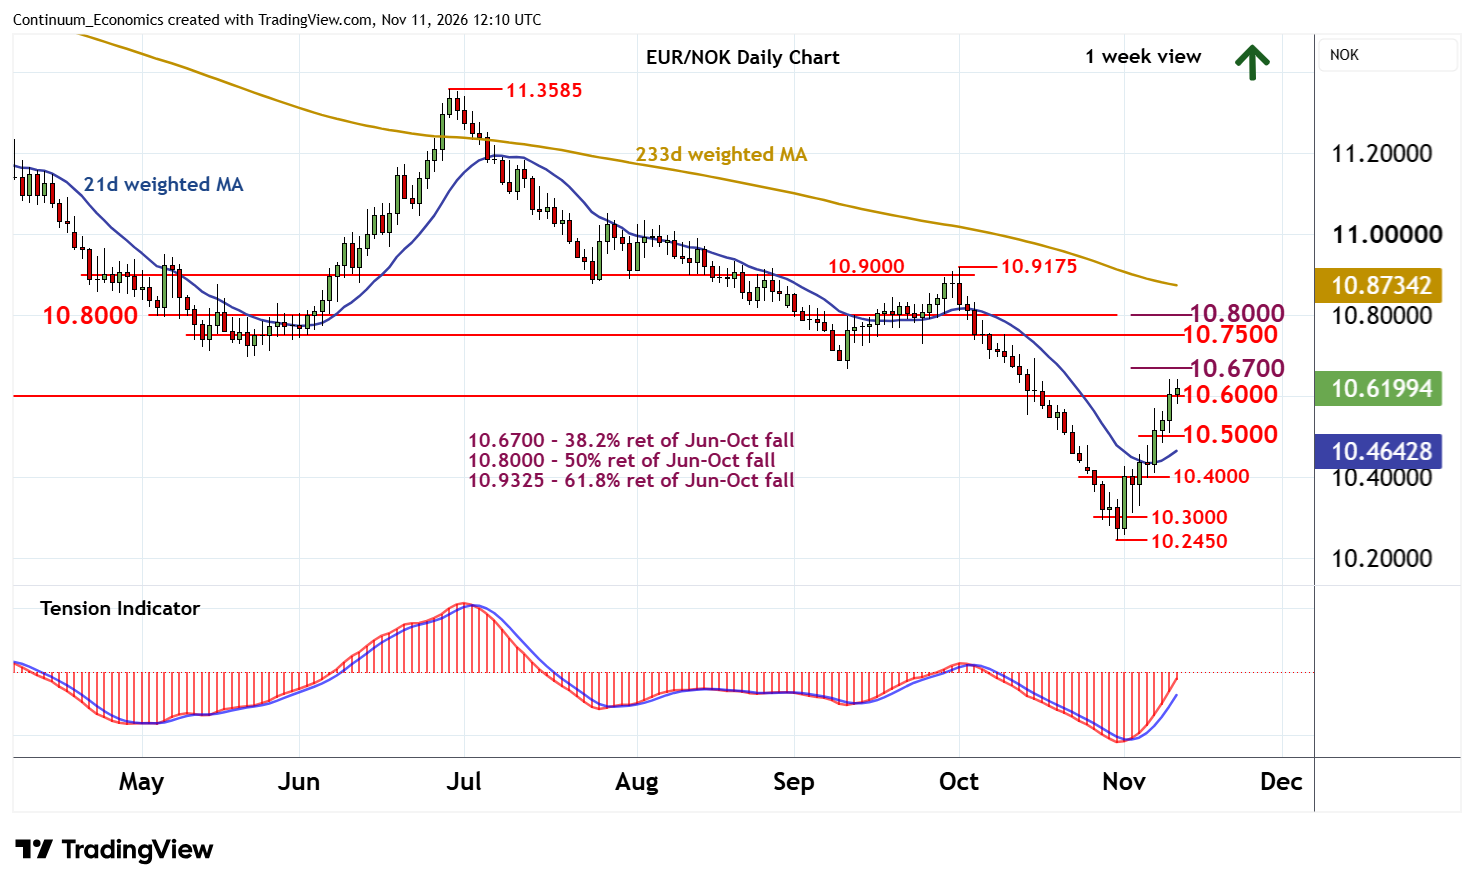
| Levels | Imp | Comment | Levels | Imp | Comment | |||
|---|---|---|---|---|---|---|---|---|
| R4 | 10.9000 | ** | break level | S1 | 10.6000 | * | break level | |
| R3 | 10.8000 | ** | break level, 50% ret | S2 | 10.5000 | * | break level | |
| R2 | 10.7500 | * | break level | S3 | 10.4000 | * | congestion | |
| R1 | 10.6700 | ** | 38.2% ret of Jun-Oct fall | S4 | 10.2450 | ** | 30 Oct YTD low |
Asterisk denotes strength of level
11:40 GMT - Anticipated gains from the 10.2450 current year low of 30 October are extending in NOK-driven trade, with prices currently consolidating the break above 10.6000. Immediate focus is on the 10.6700 Fibonacci retracement. But flat overbought daily stochastics could limit any immediate tests in consolidation/range trade, before the rising daily Tension Indicator and improving weekly charts prompt a break. A close above 10.6700 will further improve sentiment and extend October gains towards strong resistance within the 10.7500 - 10.8000 range.
Meanwhile, a close below 10.6000 would turn sentiment neutral, and prompt fresh consolidation above 10.5000. An unexpected close beneath here would weigh on sentiment, as focus then turns to congestion around 10.4000.