Published: 2026-11-04T01:39:59.000Z
Chart EUR/JPY Update: Extending gains
-
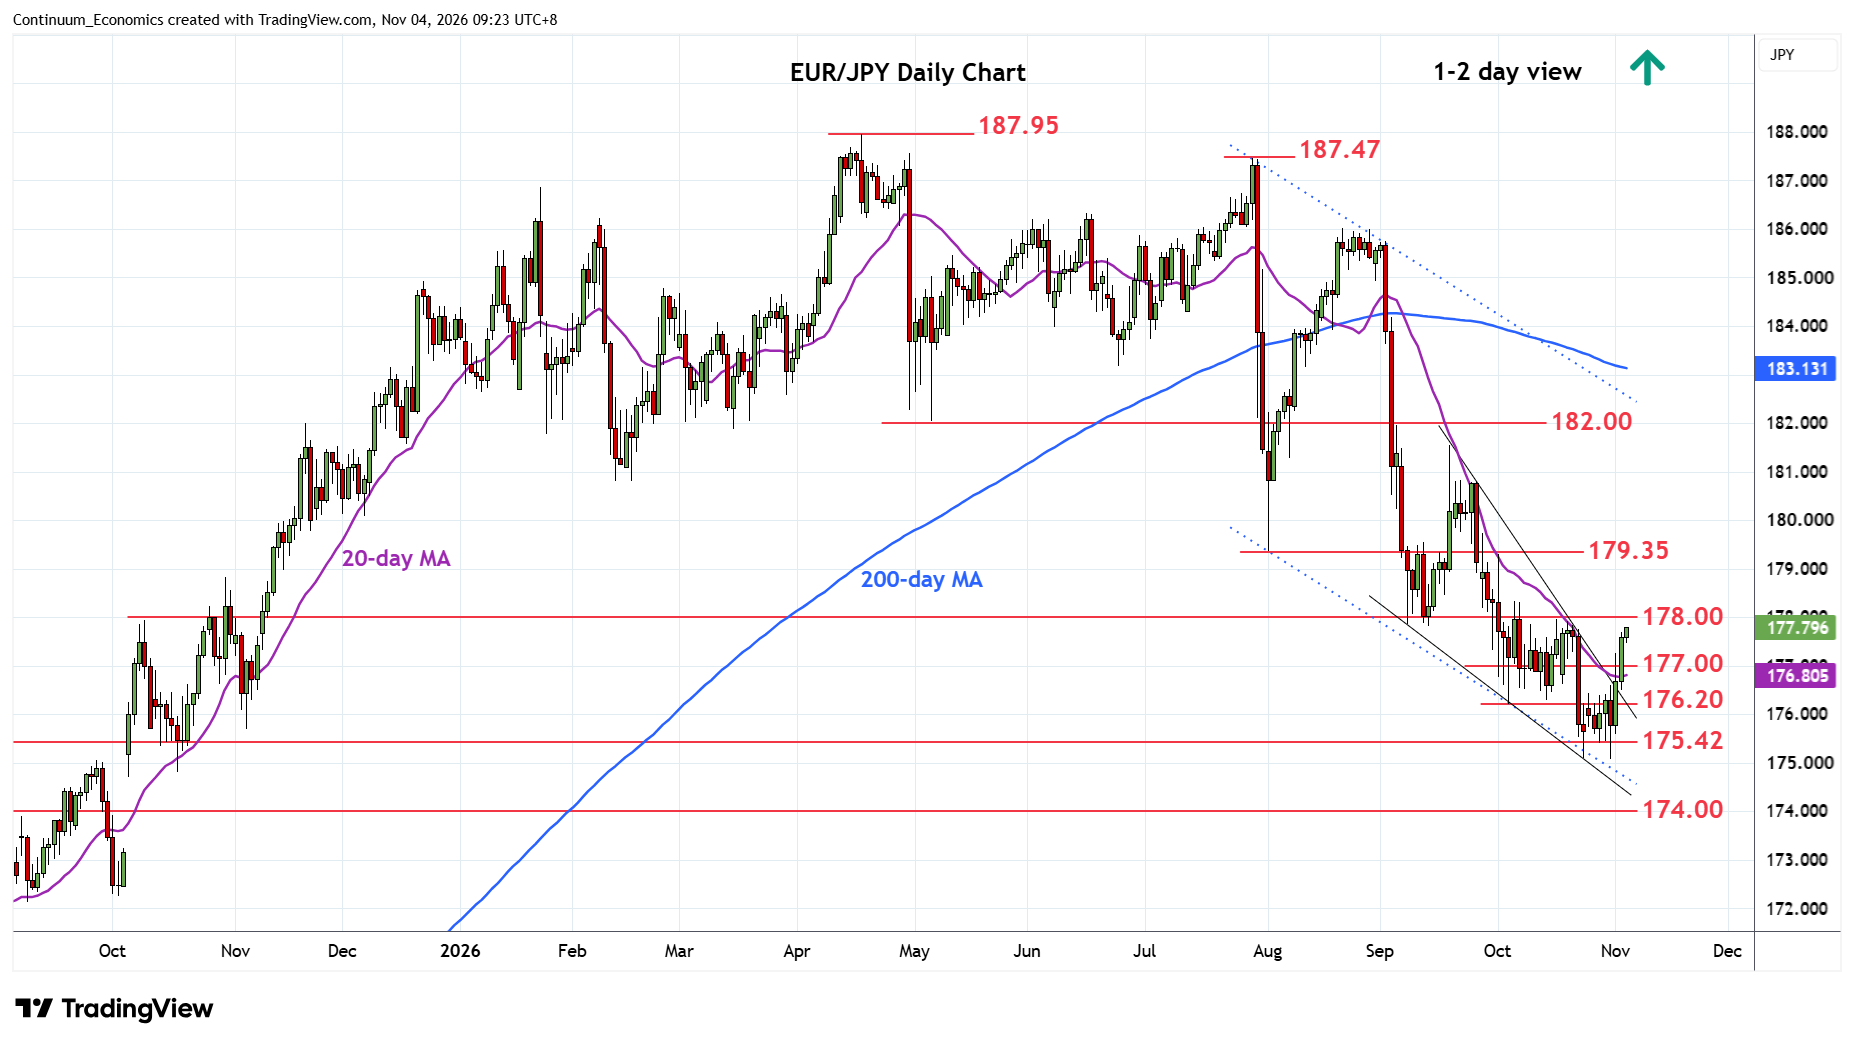
Sharply higher through the 177.00 level as prices extend bounce from the 175.10/08 October double bottom
| Levels | Imp | Comment | Levels | Imp | Comment | |||
|---|---|---|---|---|---|---|---|---|
| R4 | 180.00 | ** | figure | S1 | 177.00 | * | congestion | |
| R3 | 179.35 | ** | Aug low | S2 | 176.20 | * | 5 Oct low | |
| R2 | 179.00 | * | congestion | S3 | 175.42 | * | Jul 2024 year low | |
| R1 | 178.00 | ** | congestion | S4 | 175.08 | ** | 30 Oct YTD low |
Asterisk denotes strength of level
01:30 GMT - Sharply higher through the 177.00 level as prices extend bounce from the 175.10/08 October double bottom to reach towards the 178.00 level. Would expect reaction at the latter but postive daily and weekly studies suggest scope for break here to retrace losses from the 186.00 August high. Clearance will see room to strong resistance at the 179.00 congestion then the 179.35, August high. Meanwhile, support is raised to the 177.00 level which should underpin and sustain bounce from the 175.10/08 lows.