Continuum Economics
  • Search
  • About Us
  • Buy
  • Invite A Friend
  • My Basket
  • Articles
  • Calendar
  • Forecasts
  • Events
  • Data
  • Newsletters
  • My Alerts
  • Community
  • Directory
  • About Us
  • Buy
  • Invite A Friend
  • My Basket
  • Articles
    • All
    • Thematic
    • Tactical
    • Asia
    • EMEA
    • Americas
    • Newsletters
    • Freemium
    • Editor's Choice
    • Most Viewed
    • Most Shared
    • Most Liked
  • Calendar
    • Interactive
      • China
      • United States
      • Eurozone
      • United Kingdom
    • Month Ahead
    • Reviews
    • Previews
  • Forecasts
    • Forecasts
    • Key Views
  • Events
    • Media
    • Conference Calls
  • Data
    • Country Insights
    • Shadow Credit Ratings
    • Full CI Data Download
  • Newsletters
  • My Alerts
  • Community
    • FX
    • Fixed Income
    • Macro Strategy
    • Credit Markets
    • Equities
    • Commodities
    • Precious Metals
    • Renewables
  • Directory
  • My Account
  • Notifications Setup
  • Administration Panel
  • Account Details
  • Recent Devices
  • Distribution Lists
  • Shared Free Trials
  • Saved Articles
  • Shared Alerts
  • My Posts
Back
Published: 2026-03-13T13:48:17.000Z

Chartbook: UK Chart FTSE 100 Update: Sharp pullback from all-time highs

1

Consolidation beneath 10,000 has given way to a sharp break higher

Consolidation beneath 10,000 has given way to a sharp break higher,

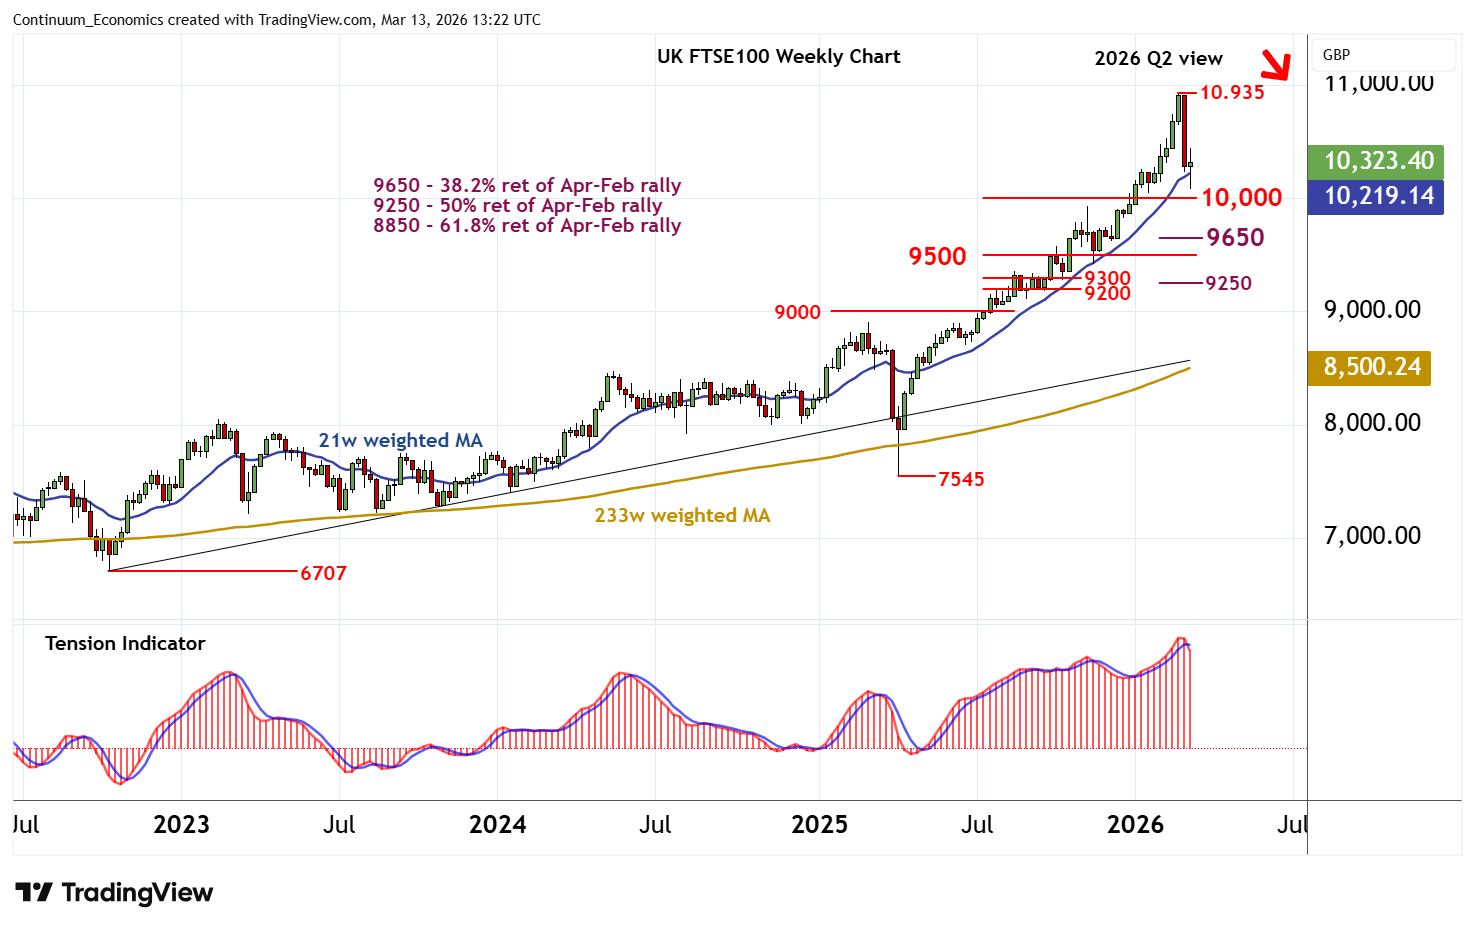
with prices posting fresh all-time highs just shy of 11,000 before falling sharply.

Overbought weekly stochastics are unwinding and the weekly Tension Indicator has turned down, highlighting a deterioration in sentiment and room for further losses into early 2026Q2.

A break below support at 10,000 will add weight to sentiment and signal a deeper correction of the 2025-2026 rally, as focus then turns to the 9650 Fibonacci retracement. But by-then oversold weekly stochastics and falling monthly stochastics could limit any deeper reactions in consolidation above congestion around 9500.

Meanwhile, resistance is at the 10,935 all-time high of 27 February.

Following a period of corrective/cautious trade, the rising monthly Tension Indicator and positive longer-term multi-month charts highlight room for further gains.

However, a close above 10,935 is needed to turn sentiment positive once and confirm continuation of multi-year bull trends into fresh all-time highs.

Continue to read the article for free
Login

or

or

Topics
GB FTSE 100-TA
Technical Analysis
ChartBook

GENERAL

  • Home
  • About Us
  • Our Team
  • Careers

LEGAL

  • Terms and Conditions
  • Privacy Policy
  • Compliance
  • GDPR

GET IN TOUCH

  • Contact Us
Continuum Economics
The Technical Analyst Awards Winner 2021
The Technical Analyst Awards Finalist 2020

© 2026 Continuum Economics

image