Published: 2026-07-08T01:05:43.000Z
Chart USD/JPY Update: Extending Friday's bounce
4
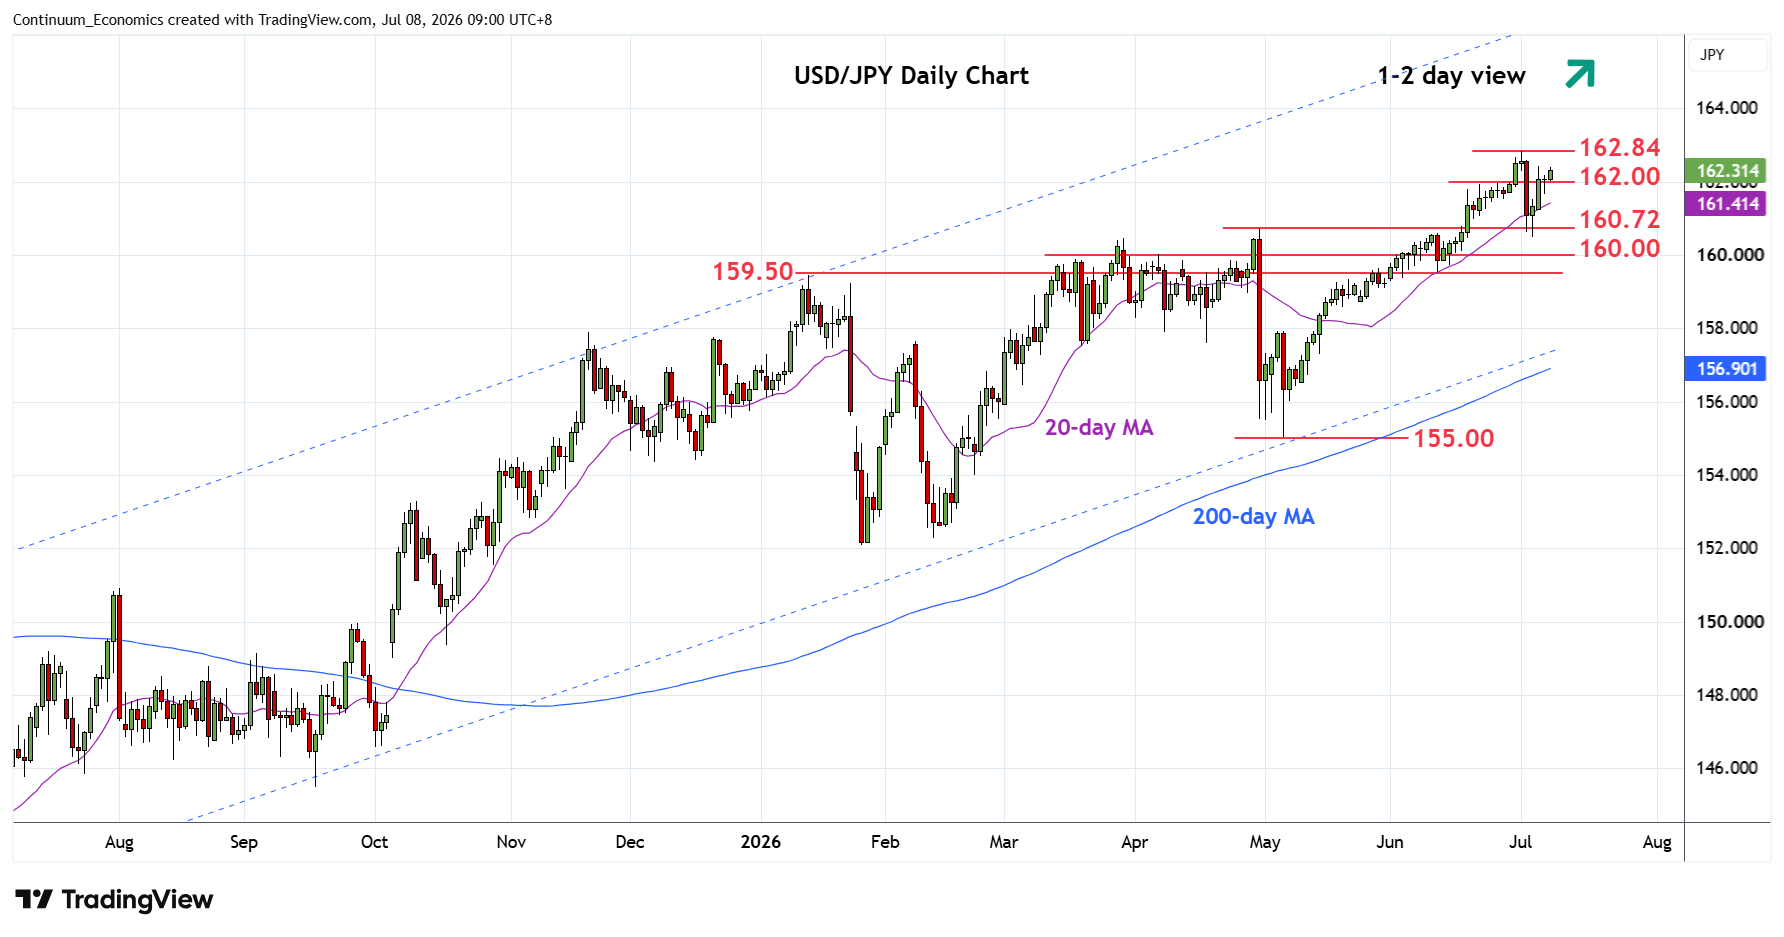
Sustaining gains above the 162.00 level to extend bounce from 160.48 low of last Friday
| Levels | Imp | Comment | Levels | Imp | Comment | |||
|---|---|---|---|---|---|---|---|---|
| R4 | 164.00 | * | Dec 1986 high | S1 | 162.00 | * | congestion | |
| R3 | 163.00 | * | congestion from Dec 1986 | S2 | 161.00 | * | congestion | |
| R2 | 162.84 | ** | 1 Jul multi-year high | S3 | 160.48 | ** | 3 Jul low | |
| R1 | 162.50 | congestion | S4 | 160.00 | * | congestion |
Asterisk denotes strength of level
01:00 GMT - Sustaining gains above the 162.00 level to extend bounce from 160.48 low of last Friday. Bullish price action suggest scope for retest of the 162.84 high. Break here, if seen, will extend the underlying bull trend and see room for gains to the 163.00/164.00 congestion from December 1986. Meanwhile, support remains at the 162.00/161.00 area which should underpin. Would take break here to expose the 160.48 Friday's low to retest and threatens deeper pullback to retrace rally from the May low to the 160.00 figure and strong support at 159.50.