Published: 2026-07-13T05:46:34.000Z
Chart USD Index DXY Update: Higher in consolidation
3
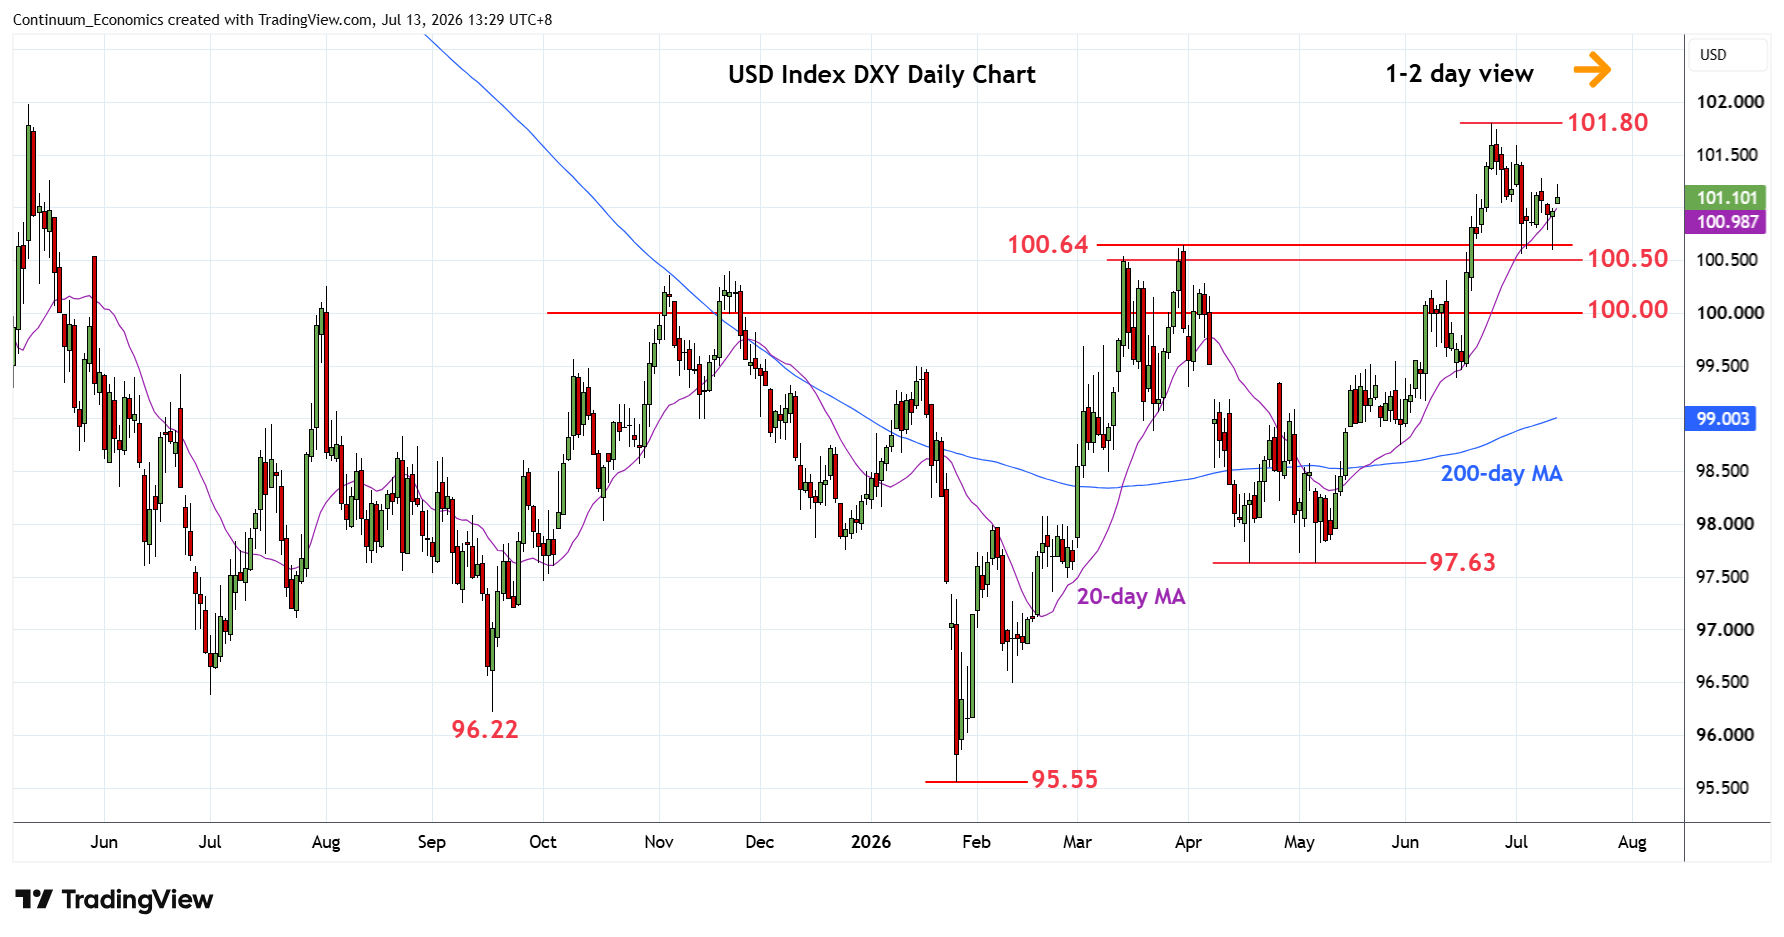
Gapped up at the open see prices back above 101.00 level as prices extend bounce from the 100.64/100.50 support area
| Levels | Imp | Comment | Levels | Imp | Comment | |||
|---|---|---|---|---|---|---|---|---|
| R4 | 102.50 | * | congestion | S1 | 101.00 | * | congestion | |
| R3 | 102.00 | ** | congestion | S2 | 100.64 | ** | Mar high | |
| R2 | 101.80 | ** | 24 Jun YTD high | S3 | 100.50 | * | congestion | |
| R1 | 101.50 | * | congestion | S4 | 100.20 | * | 38.2% Apr/Jun rally |
Asterisk denotes strength of level
05:40 GMT - Gapped up at the open see prices back above 101.00 level as prices extend bounce from the 100.64/100.50 support area. Daily studies have turned mixed but overbought weekly chart suggest consolidation here giving way to renewed selling pressure later. Lower will see prices extending the late-June losses towards the 100.20 Fibonacci retracement then the 100.00 level. Meanwhile, resistance at 101.50 congestion is expected to cap. Clearance here will expose the 101.80 high to retest and further extend gains within the bull channel from January current year low.