Chart USD/CAD Update: Consolidating test of critical resistance
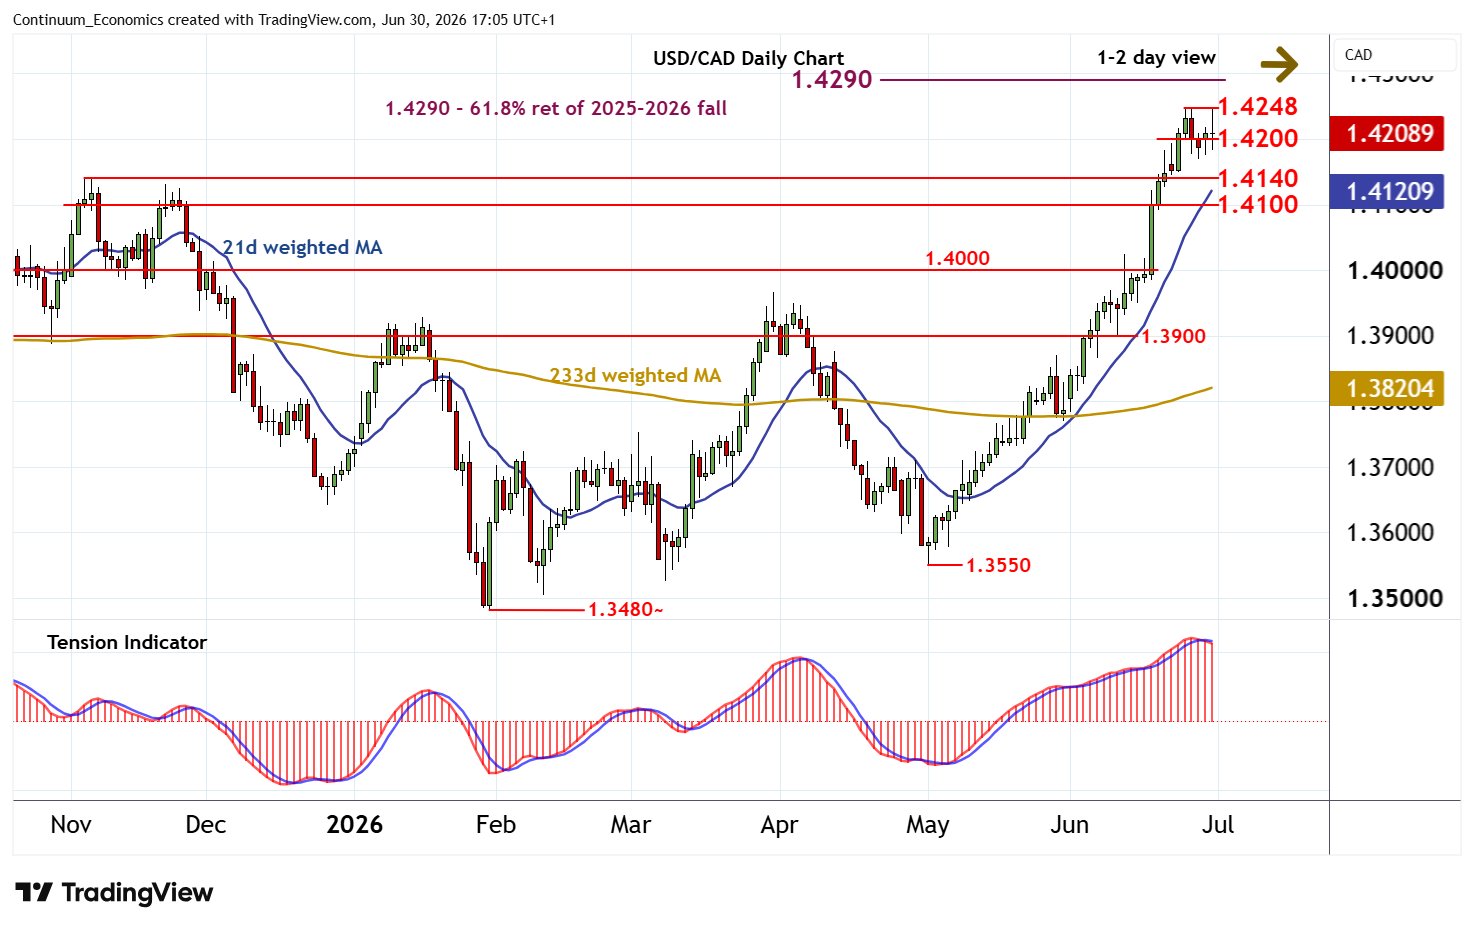
The anticipated test of critical resistance at the 1.4248 current year high of 24 June is giving way to a drift lower
| Levels | Imp | Comment | Levels | Imp | Comment | |||
|---|---|---|---|---|---|---|---|---|
| R4 | 1.4400 | * | congestion | S1 | 1.4200 | * | congestion | |
| R3 | 1.4350 | * | congestion | S2 | 1.4140 | ** | 5 Nov (m) high | |
| R2 | 1.4290 | ** | 61.8% ret of 2025-2026 fall | S3 | 1.4000 | ** | break level | |
| R1 | 1.4248 | * | 24 Jun YTD high | S4 | 1.3930 | intraday lows |
Asterisk denotes strength of level
16:40 BST - The anticipated test of critical resistance at the 1.4248 current year high of 24 June is giving way to a drift lower, as intraday studies turn down, with prices currently pressuring congestion support at 1.4200. Daily stochastics continue to track lower and the daily Tension Indicator is under pressure, highlighting room for a break back beneath here towards the 1.4140 monthly high of 5 November. However, mixed/positive weekly charts should limit any tests of this range in renewed buying interest/consolidation. Following cautious/ corrective trade, fresh gains are looked for. However, a close above 1.4248 is needed to turn sentiment positive and extend January gains initially towards the 1.4290 Fibonacci retracement.