Published: 2026-05-22T06:51:14.000Z
Chart AUD/NZD Update: Extend pullback from 1.2250 high
2
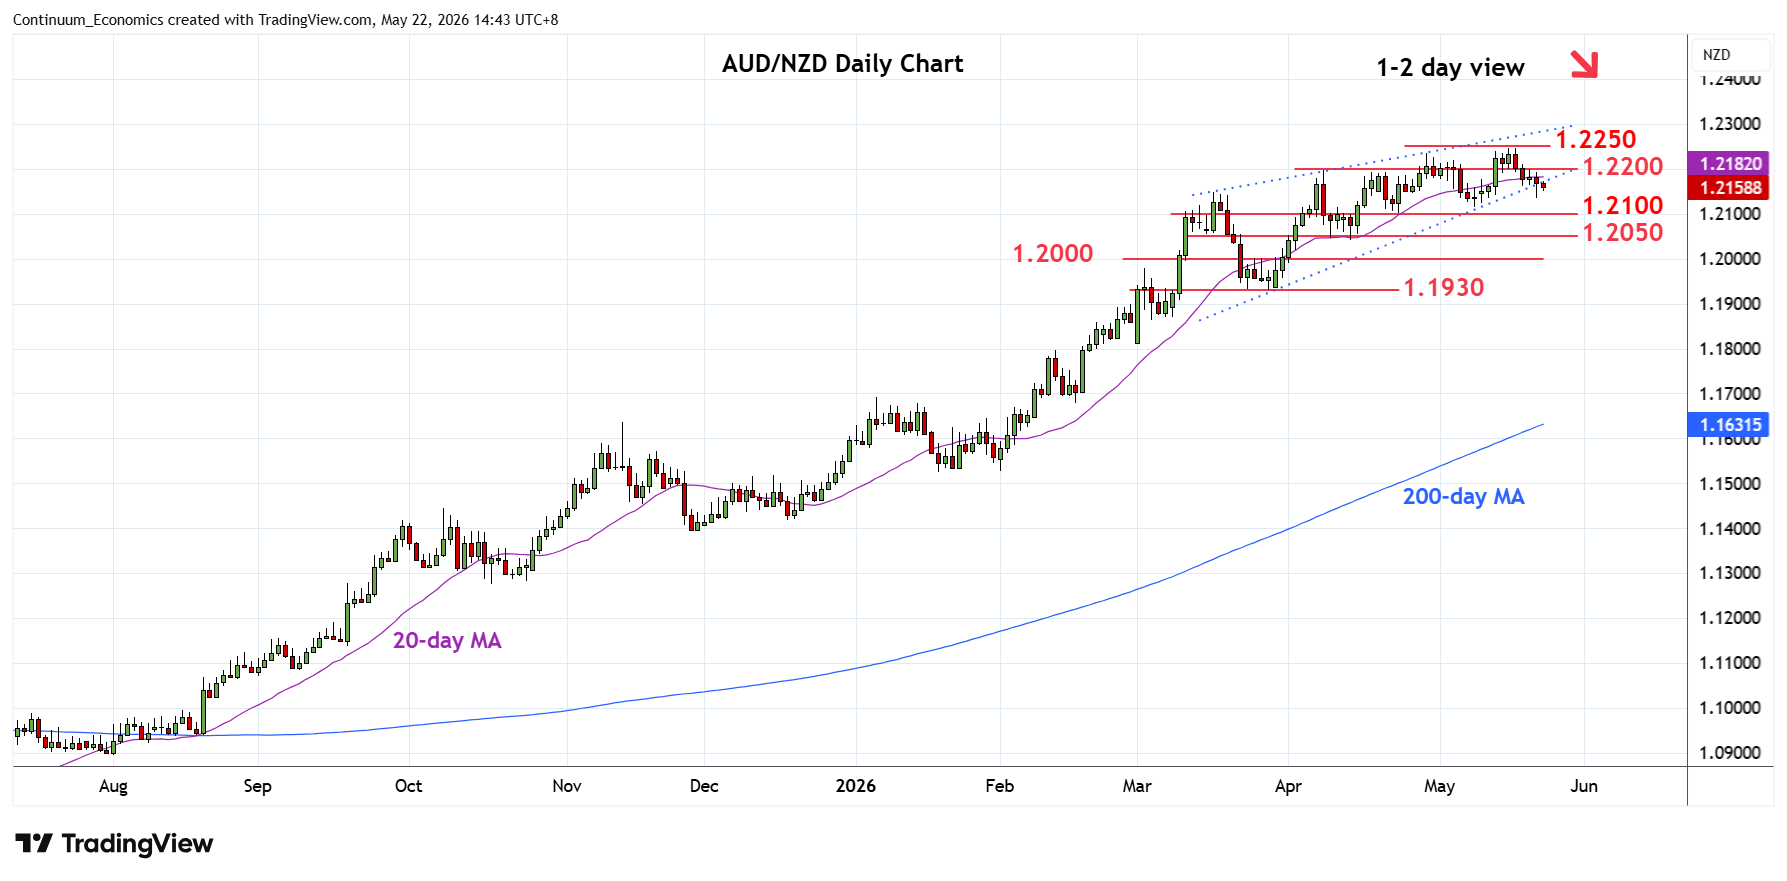
Break of a 2-month wedge pattern see prices extending pullback from the 1.2250 high towards strong support at the 1.2115/00 area
| Level | Comment | Level | Comment | |||||
|---|---|---|---|---|---|---|---|---|
| R4 | 1.2345 | * | 61.8% 2011/2020 fall | S1 | 1.2115/00 | ** | 8 May low, congestion | |
| R3 | 1.2300/10 | * | congestion, 2011 yr low | S2 | 1.2050 | ** | congestion | |
| R2 | 1.2250 | ** | 15 May YTD high | S3 | 1.2000 | * | congestion | |
| R1 | 1.2200 | congestion | S4 | 1.1930 | ** | 27 Mar low |
Asterisk denotes strength of level
06:45 GMT - Break of a 2-month wedge pattern see prices extending pullback from the 1.2250 high towards strong support at the 1.2115/00 area. Daily and weekly studies are unwinding overbought readings and suggest scope for break here to see deeper pullback to support at the 1.2050/1.2000 congestion area and the late-March low at 1.1930. Meanwhile, resistance at the 1.2200/1.2250 congestion and 15 May highs are expected to cap. Break here, if seen, will extend the broader gains from April 2025 year low and see room to 1.2300/45 congestion and 61.8% Fibonacci retracement.