Published: 2026-06-12T08:21:01.000Z
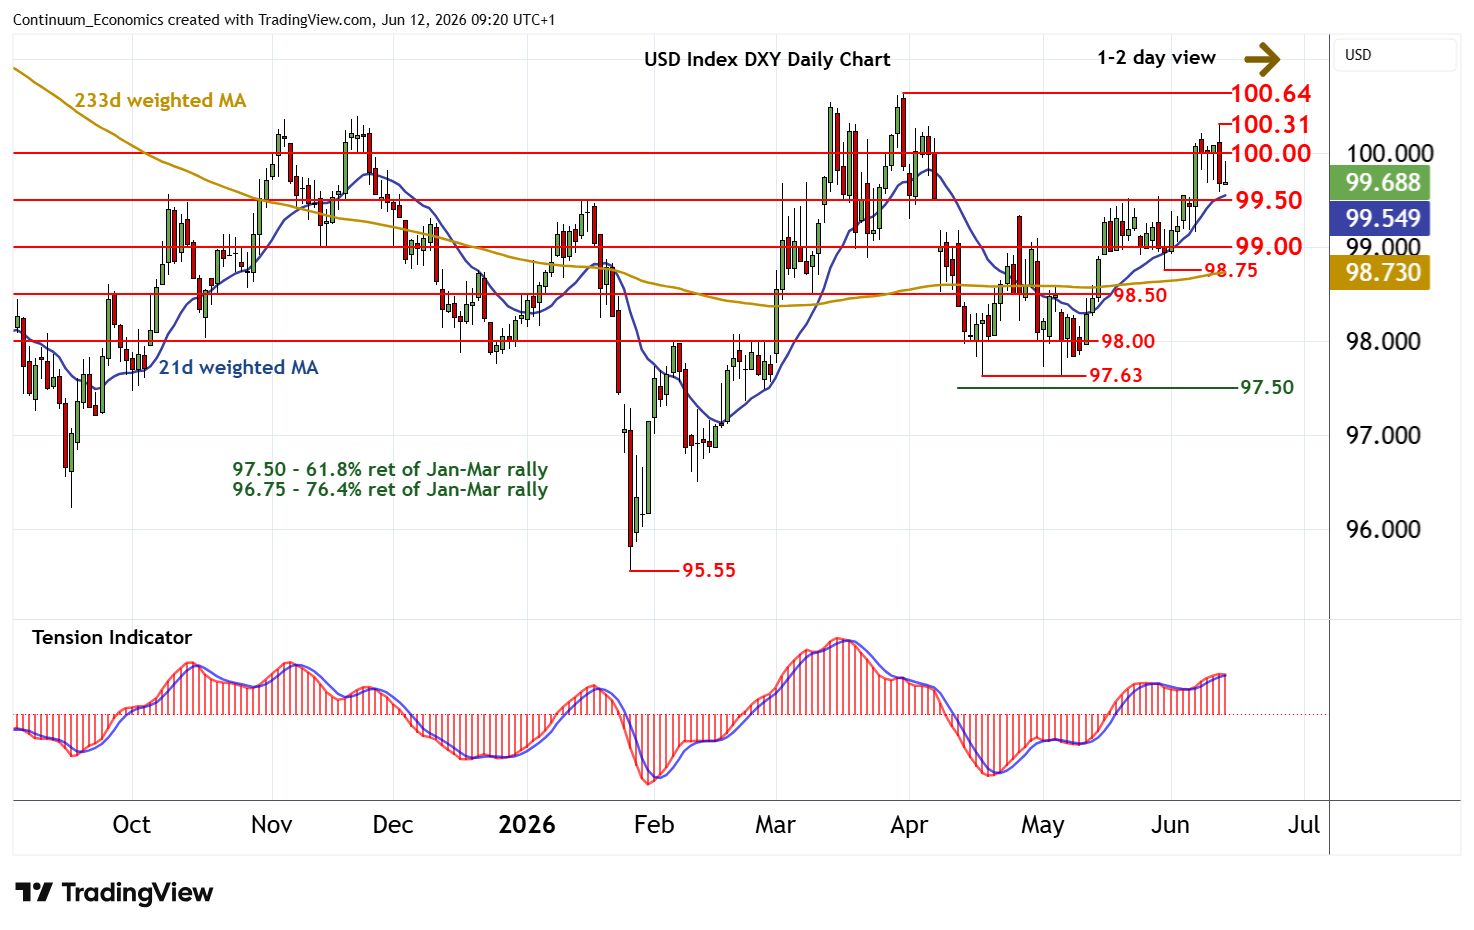
Chart USD Index DXY Update: Spike higher not sustained
2
Choppy trade around 100.00 has given way to a spike higher to 100.31
| Levels | Imp | Comment | Levels | Imp | Comment | |||
|---|---|---|---|---|---|---|---|---|
| R4 | 101.15 | ** | 38.2% ret of 2025-2026 fall | S1 | 99.50 | * | congestion | |
| R3 | 100.64 | ** | 31 Mar YTD high | S2 | 99.00 | * | congestion | |
| R2 | 100.31 | 11 Jun high | S3 | 98.75 | 29 May (w) low | |||
| R1 | 100.00 | ** | congestion | S4 | 98.50 | * | congestion |
Asterisk denotes strength of level
09:05 BST - Choppy trade around 100.00 has given way to a spike higher to 100.31, before falling sharply to currently trade around 99.75. Overbought daily stochastics are unwinding and the positive daily Tension Indicator is flattening, suggesting room for a test of congestion support at 99.50. But rising weekly charts should limit any tests beneath here in renewed buying interest/consolidation above further congestion around 99.00. Meanwhile, resistance remains at 100.00. But a close above the 100.31 high of 11 June is needed to improve sentiment and open up a test of strong resistance at the 100.64 current year high of 31 March.