Published: 2026-08-07T15:53:41.000Z
Chart USD/CAD Update: Lower in both USD- and CAD-driven trade
6
Cautious trade has given way to anticipated losses
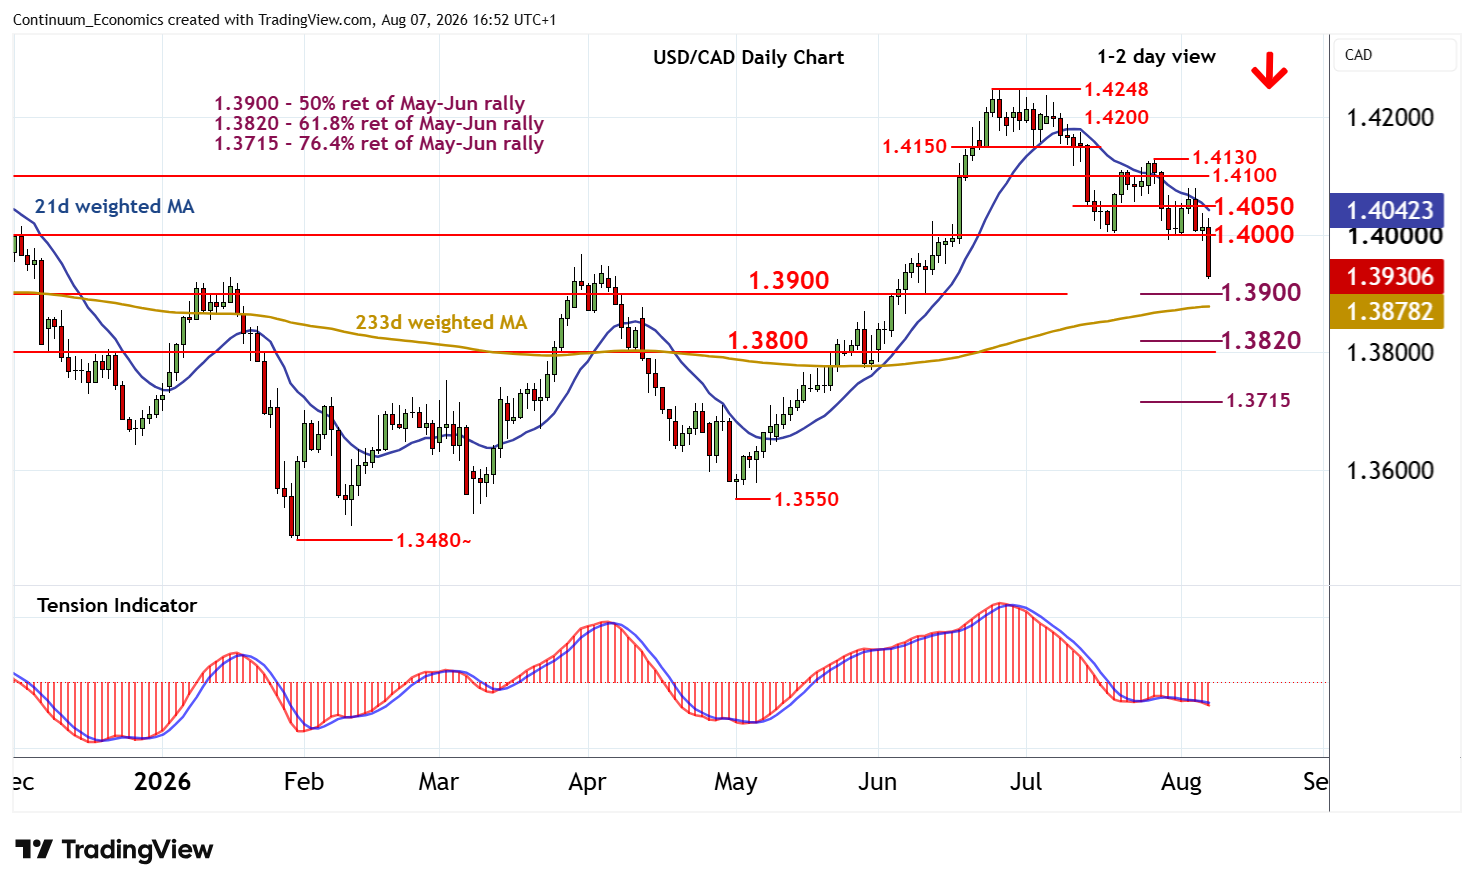
| Levels | Imp | Comment | Levels | Imp | Comment | |||
|---|---|---|---|---|---|---|---|---|
| R4 | 1.4130 | * | 28 Jul (w) high | S1 | 1.3900 | ** | congestion, 50% ret | |
| R3 | 1.4100 | * | congestion | S2 | 1.3820 | ** | 61.8% ret of May-Jun rally | |
| R2 | 1.4050 | break level | S3 | 1.3800 | ** | congestion | ||
| R1 | 1.4000 | ** | break level | S4 | 1.3715 | ** | 76.4% ret of May-Jun rally |
Asterisk denotes strength of level
16:25 BST - Cautious trade has given way to anticipated losses, with prices falling sharply in both USD- and CAD-driven trade. Focus is on strong support at 1.3900. Already oversold daily stochastics could limit any initial tests in consolidation, before the bearish daily Tension Indicator and negative weekly charts prompt further losses. A close beneath here will extend late-June losses towards 1.3800/20. Meanwhile, resistance is lowered to 1.4000. A close back above here, if seen, would help to stabilise price action and give way to consolidation beneath 1.4050.