Chart GBP/USD Update: Consolidating - studies under pressure
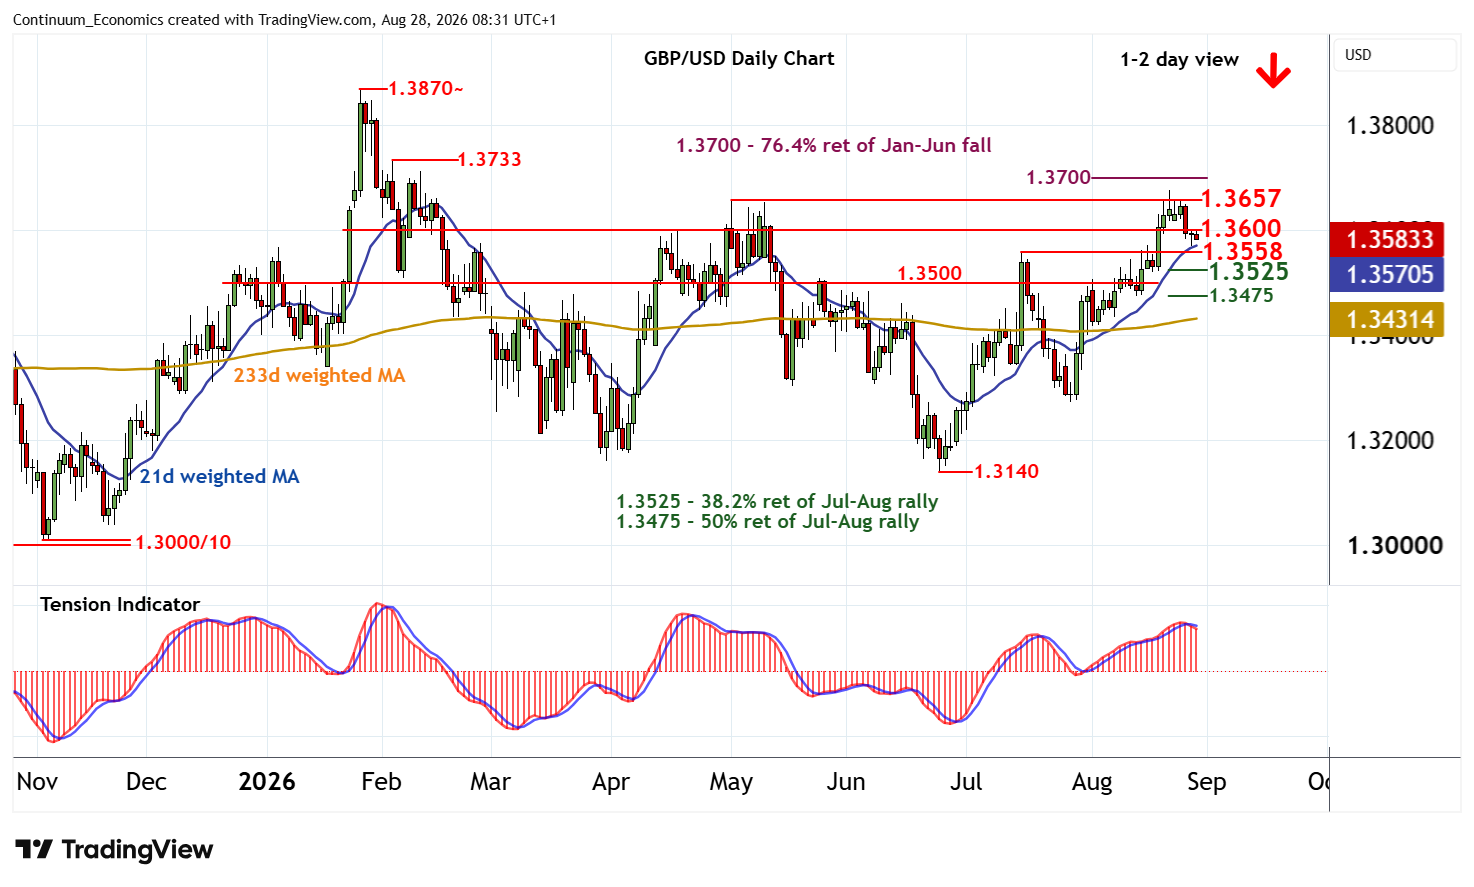
Little change, as mixed intraday studies keep near-term sentiment cautious and extend consolidation beneath congestion resistance at 1.3600
| Level | Comment | Level | Comment | |||||
|---|---|---|---|---|---|---|---|---|
| R4 | 1.3733 | 4 Feb (w) high | S1 | 1.3558 | ** | 15 Jul (m) high | ||
| R3 | 1.3700 | ** | congestion, 76.4% ret | S2 | 1.3525 | 38.2% ret of Jul-Aug rally | ||
| R2 | 1.3657 | ** | 1 May (m) high | S3 | 1.3500 | * | congestion | |
| R1 | 1.3600 | ** | congestion | S4 | 1.3475 | ** | 50% ret of Jul-Aug rally |
Asterisk denotes strength of level
08:10 BST - Little change, as mixed intraday studies keep near-term sentiment cautious and extend consolidation beneath congestion resistance at 1.3600. Daily stochastics are falling and the daily Tension Indicator is also bearish, highlighting room for further losses in the coming sessions. Focus is expected to turn back to the 1.3558 monthly high of 15 July. A break beneath here will prompt a deeper retracement towards the 1.3525 Fibonacci retracement. However, rising weekly charts could limit any initial tests beneath here in short-covering/consolidation above congestion around 1.3500.
Meanwhile, a close back above congestion resistance at 1.3600 will help to stabilise price action and give way to consolidation beneath the 1.3657 monthly high of 1 May.