Chart USD/CAD Update: Consolidating beneath fresh year highs - background studies remain positive
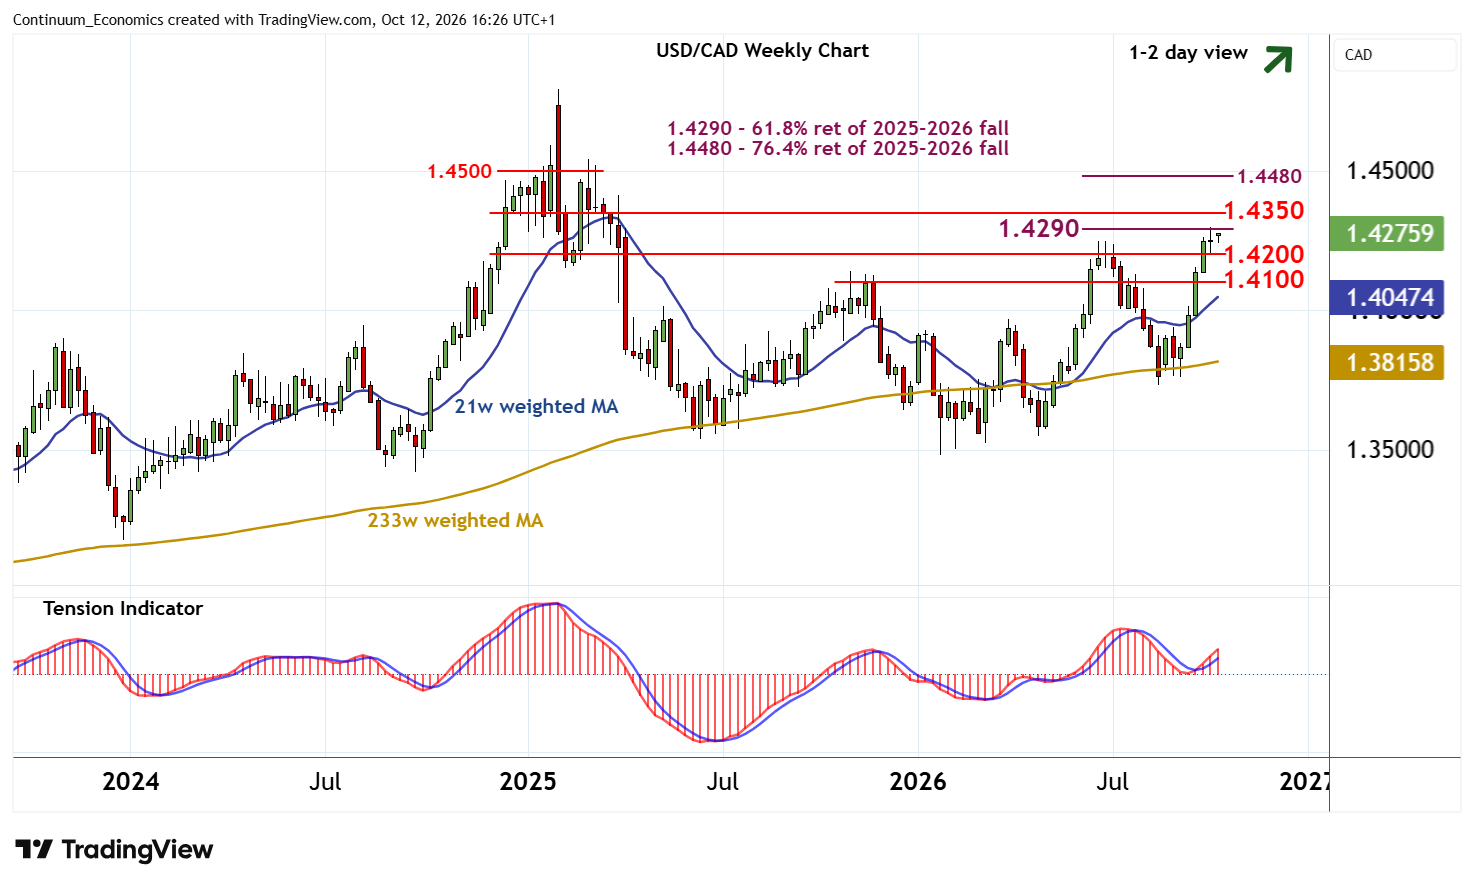
Little change, as prices extend consolidation following the pullback from strong resistance at the 1.4290 Fibonacci retracement and the 1.4300 current year high of 9 October
| Levels | Imp | Comment | Levels | Imp | Comment | |||
|---|---|---|---|---|---|---|---|---|
| R4 | 1.4400 | * | congestion | S1 | 1.4200 | ** | congestion | |
| R3 | 1.4350 | * | congestion | S2 | 1.4100 | minor congestion | ||
| R2 | 1.4300 | ** | 9 Oct YTD high | S3 | 1.4000 | ** | break level | |
| R1 | 1.4290 | ** | 61.8% ret of 2025-2026 fall | S4 | 1.3975 | * | recent range lows |
Asterisk denotes strength of level
16:10 BST - Little change, as prices extend consolidation following the pullback from strong resistance at the 1.4290 Fibonacci retracement and the 1.4300 current year high of 9 October. Intraday studies have ticked higher, suggesting room for a test of 1.4290/00. But negative daily readings should limit any initial tests in consolidation, before positive weekly charts prompt a break. A close above here will improve sentiment and extend broad January gains towards 1.4350.
Meanwhile, support remains at congestion around 1.4200. A close beneath here, if seen, would stabilise price action and give way to consolidation above further congestion around 1.4100.