Weekly Chart USD/JPY Update: Higher in consolidation within 5-week range area
Rejection from the 159.00 October high corrected 50% of the September rally to retest the 156.00 level
Rejection from the 159.00 October high corrected 50% of the September rally to retest the 156.00 level. Subsequent bounce from the latter above the 157.50 resistance see prices back to retest resistance at the 158.00/158.50 congestion area and the 200-day MA.
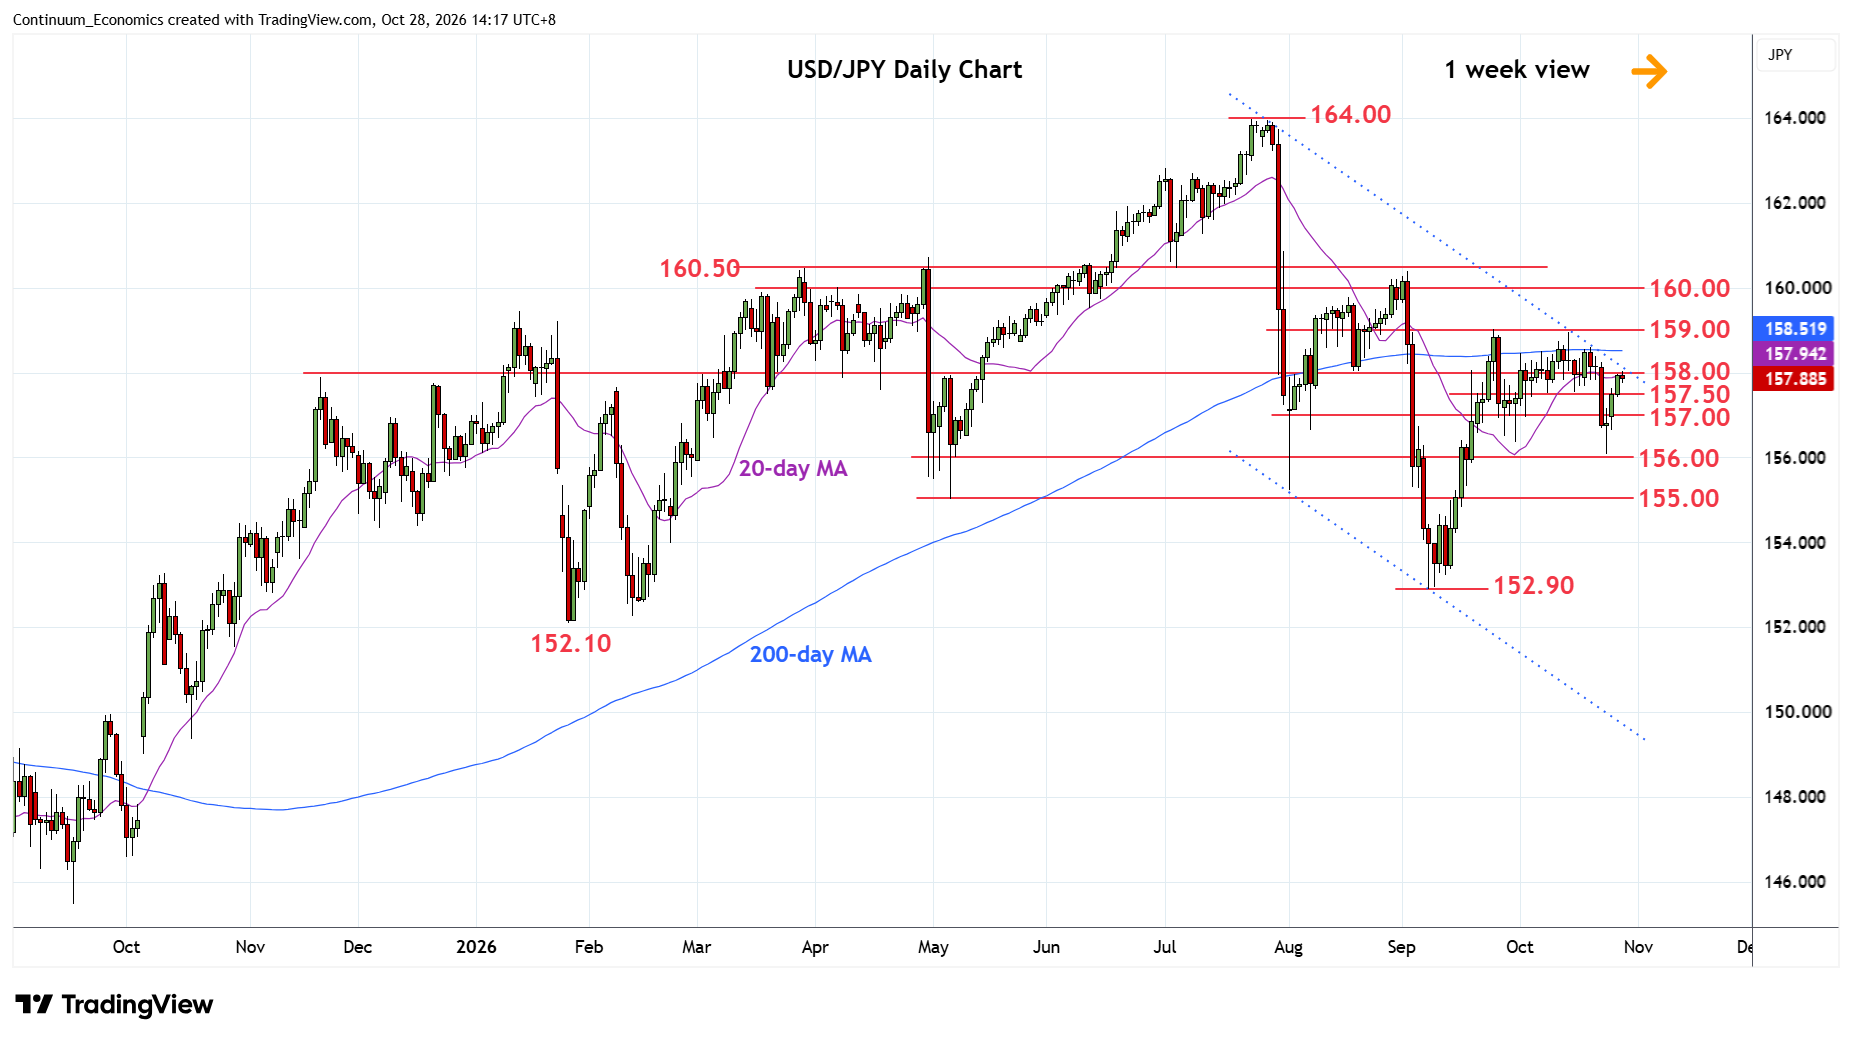
The latter also marks channel resistance from the 164.00 July current year high and is expected to cap. Clearance, if seen, will open up room for retest of strong resistance at 159.00 and see possible extension to the 160.00 figure. However, the late-July break of the trend line from April 2025 year low on weekly chart suggest gains from 152.90 September low are corrective of the July/September losses and expected to give way to fresh selling pressure later.
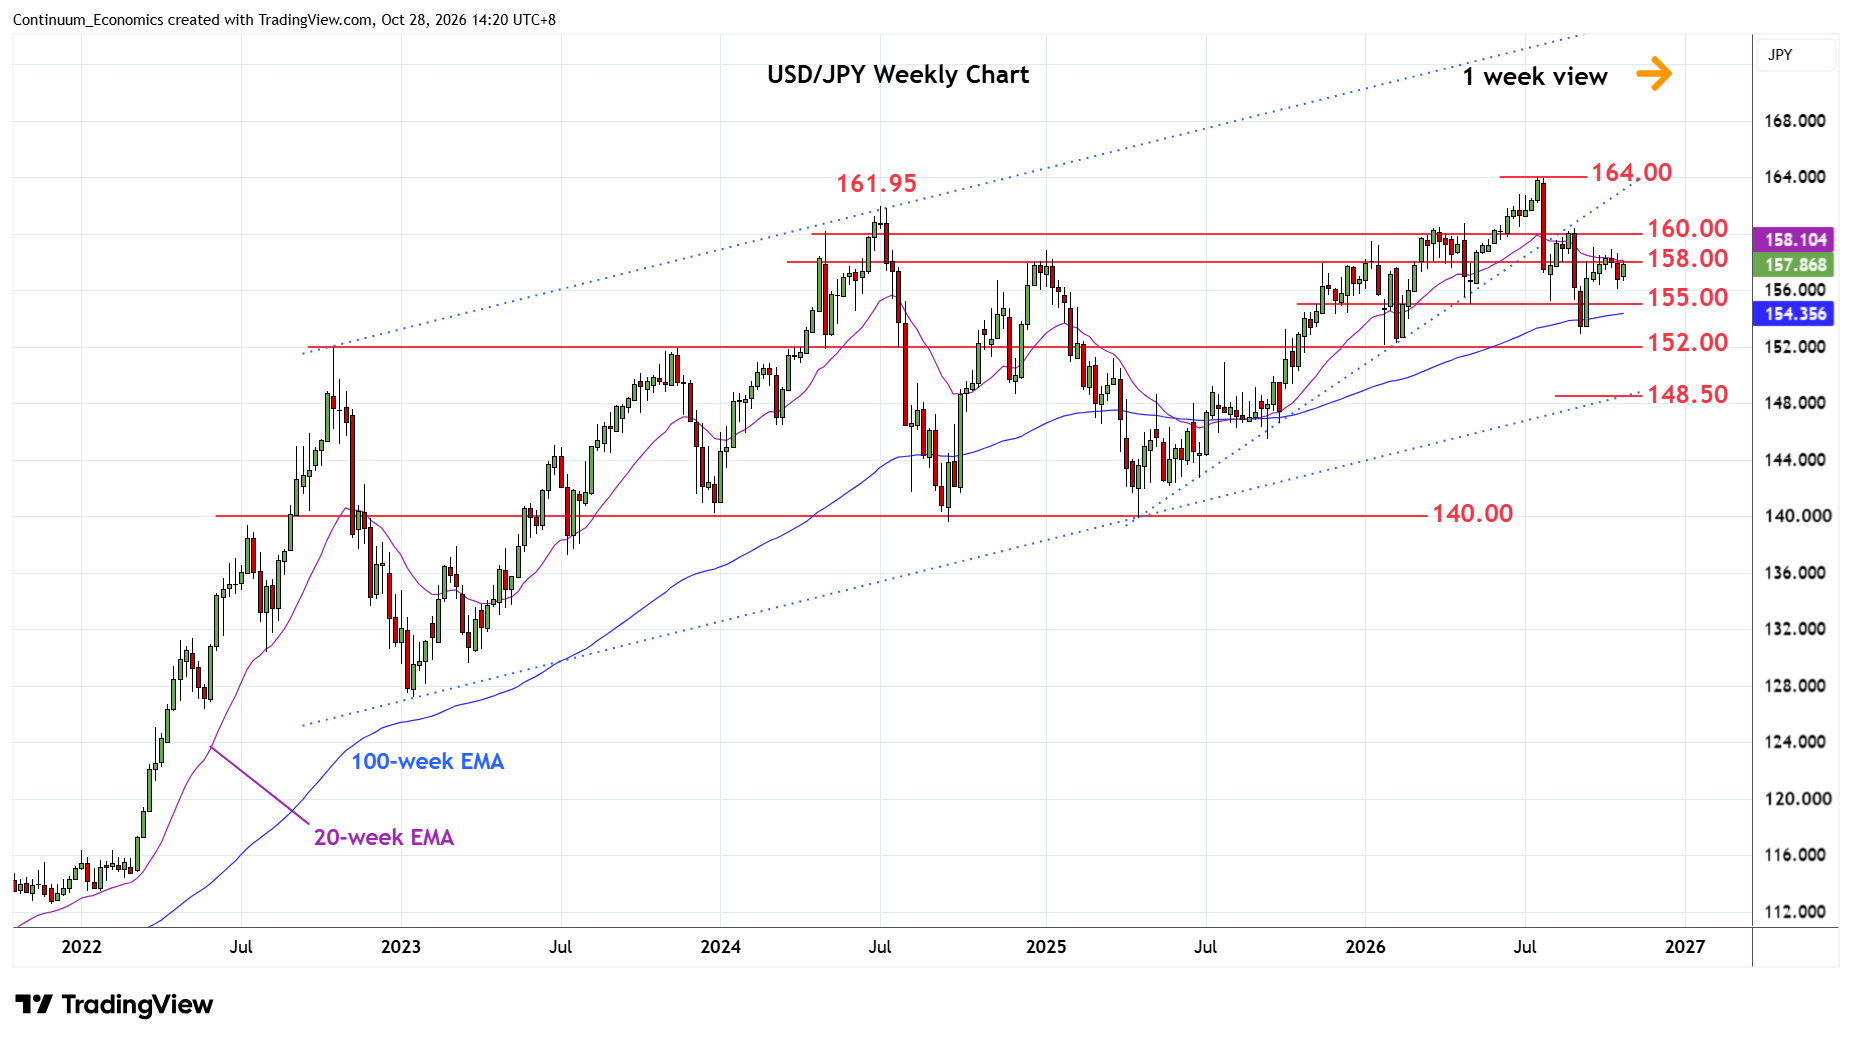
Break of the 156.00 support will expose the 155.00 May low to retest but potential will be seen for losses to retest the 152.90 September low and the strong support at 152.10/152.00, January current year low and previous 2022 and 2023 year highs.