Published: 2026-06-25T11:17:24.000Z
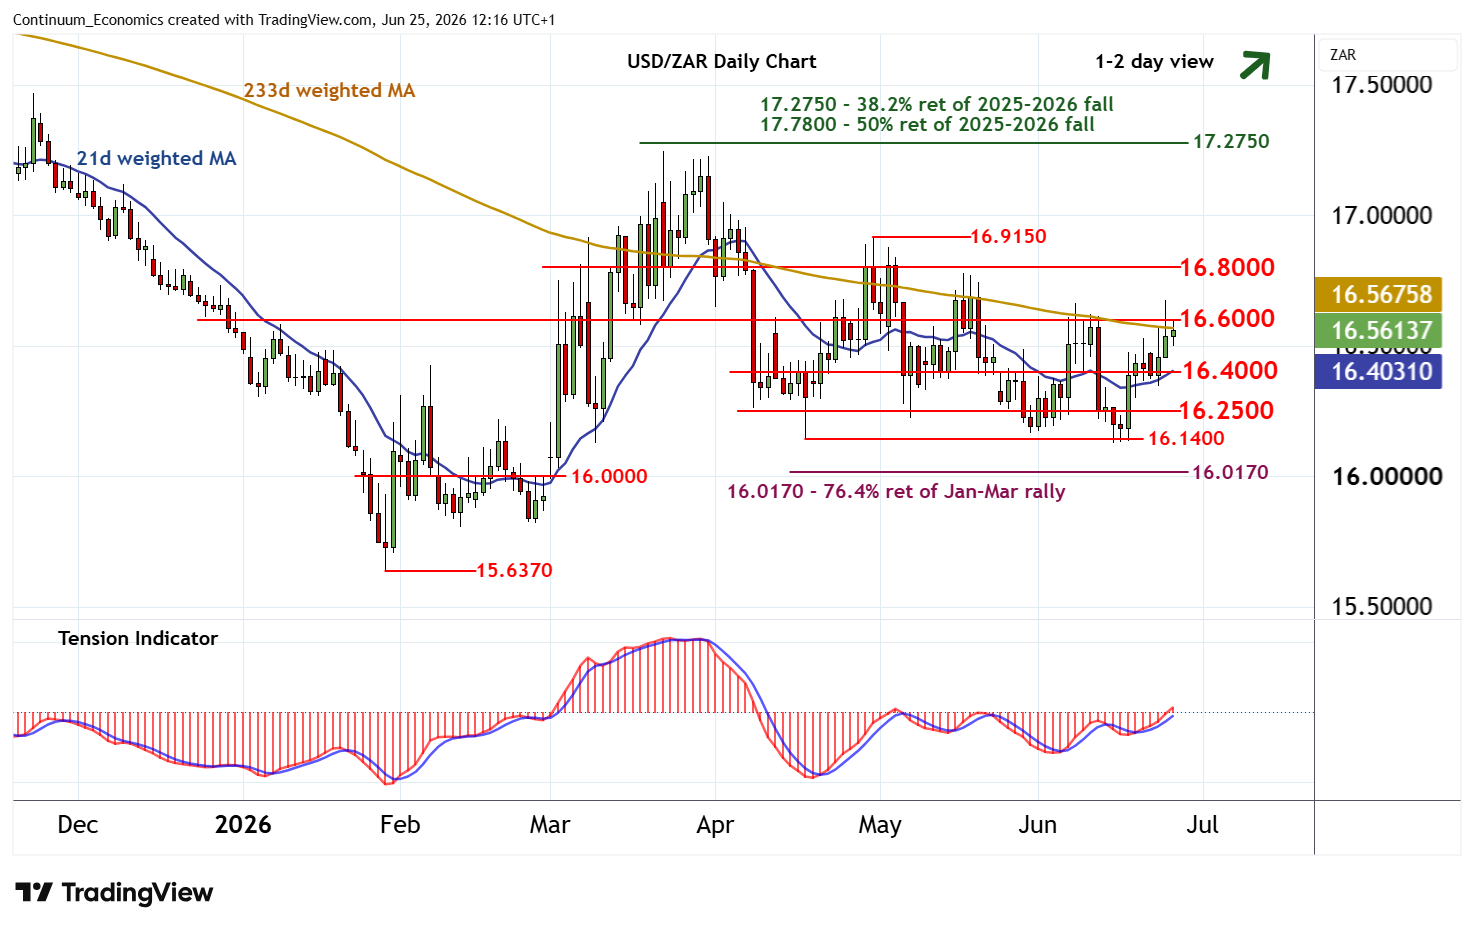
Chart USD/ZAR Update: Back in range - daily studies rising
-
The test above 16.6000 has been pushed back from 16.6750
| Level | Comment | Level | Comment | |||||
|---|---|---|---|---|---|---|---|---|
| R4 | 16.9150 | ** | 30 Apr (w) high | S1 | 16.4000 | congestion | ||
| R3 | 16.8000 | ** | congestion | S2 | 16.2500 | * | congestion | |
| R2 | 16.6750 | 24 Jun high | S3 | 16.1400 | ** | 17 Apr (m) low | ||
| R1 | 16.6000 | * | congestion | S4 | 16.0170 | ** | 76.4% ret of Jan-Mar rally |
Asterisk denotes strength of level
12:05 BST - The test above 16.6000 has been pushed back from 16.6750, as intraday studies turn down, with prices once again trading back below 16.6000. Daily stochastics and the daily Tension Indicator continue to rise, highlighting room for a fresh test above here towards congestion resistance at 16.8000. But mixed weekly charts are expected to limit any initial tests in fresh consolidation. Meanwhile, support remains at congestion around 16.4000 and should underpin any immediate setbacks.