Published: 2026-11-10T08:34:59.000Z
Chart GBP/USD Update: Pushing higher
1
Consolidation around 1.3400 has given way to continuation higher
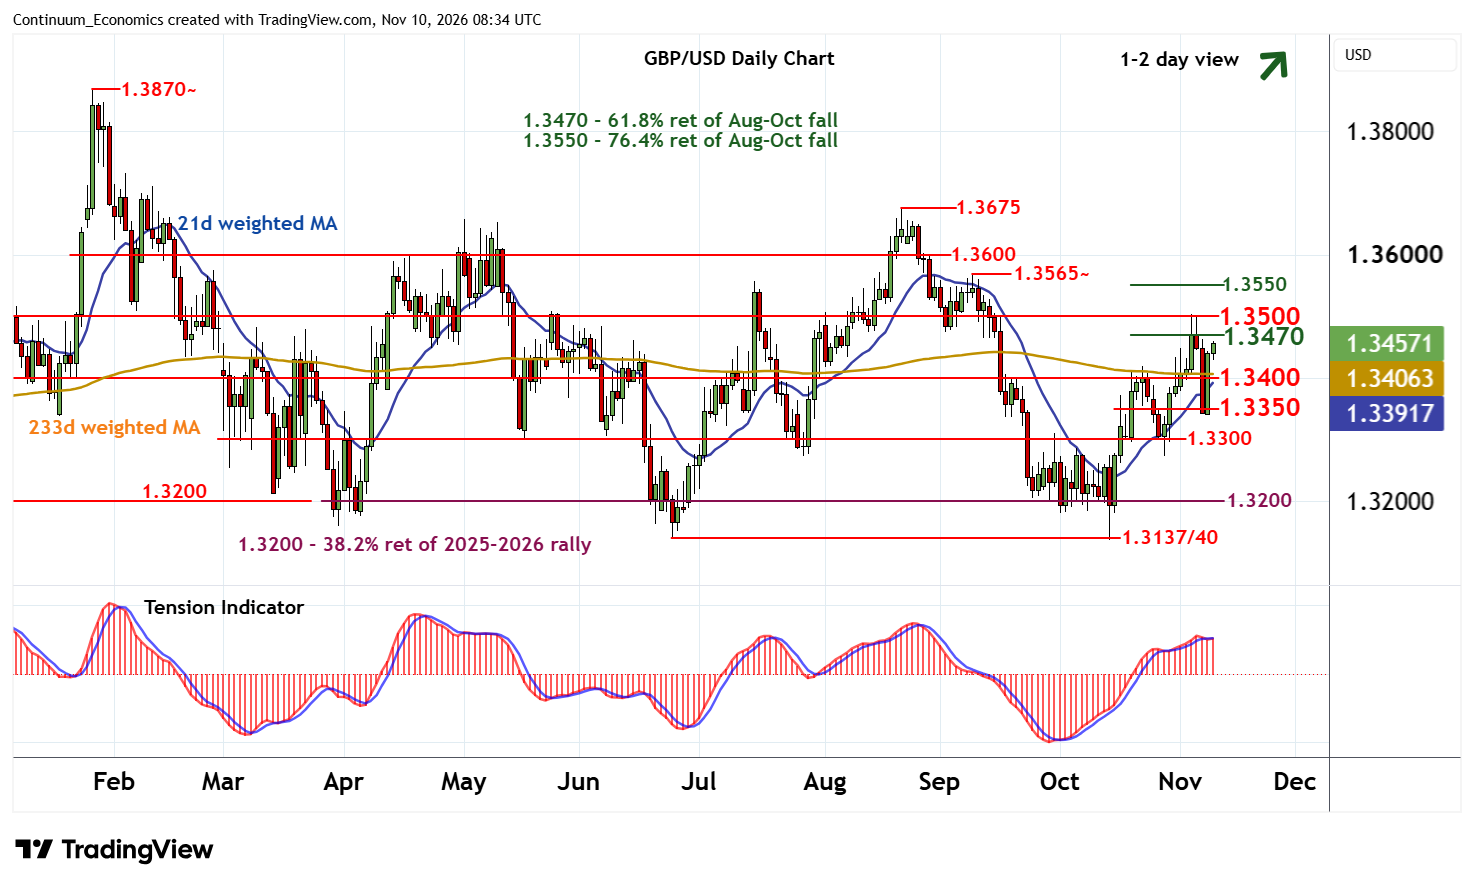
| Level | Comment | Level | Comment | |||||
|---|---|---|---|---|---|---|---|---|
| R4 | 1.3565 | * | 9 Sep (m) high | S1 | 1.3400 | ** | congestion | |
| R3 | 1.3550 | ** | 76.4% ret of Aug-Oct fall | S2 | 1.3350 | break level | ||
| R2 | 1.3500 | ** | congestion | S3 | 1.3300 | ** | congestion | |
| R1 | 1.3470 | ** | 61.8% ret of Aug-Oct fall | S4 | 1.3250 | * | congestion |
Asterisk denotes strength of level
08:10 GMT - Consolidation around 1.3400 has given way to continuation higher, with focus turning to resistance at the 1.3470 Fibonacci retracement. Rising intraday studies highlight room for a test above here. But negative daily readings should limit any initial break in profit-taking/consolidation beneath congestion around 1.3500. Rising weekly charts point to a later break. But negative longer-term charts are expected to prompt more significant selling interest beneath the 1.3550 retracement.
Meanwhile, support is raised to congestion around 1.3400. A break, if seen, will open up 1.3350, where fresh consolidation is expected to appear.