Published: 2026-10-08T00:56:48.000Z
Chart EUR/JPY Update: Under pressure
1
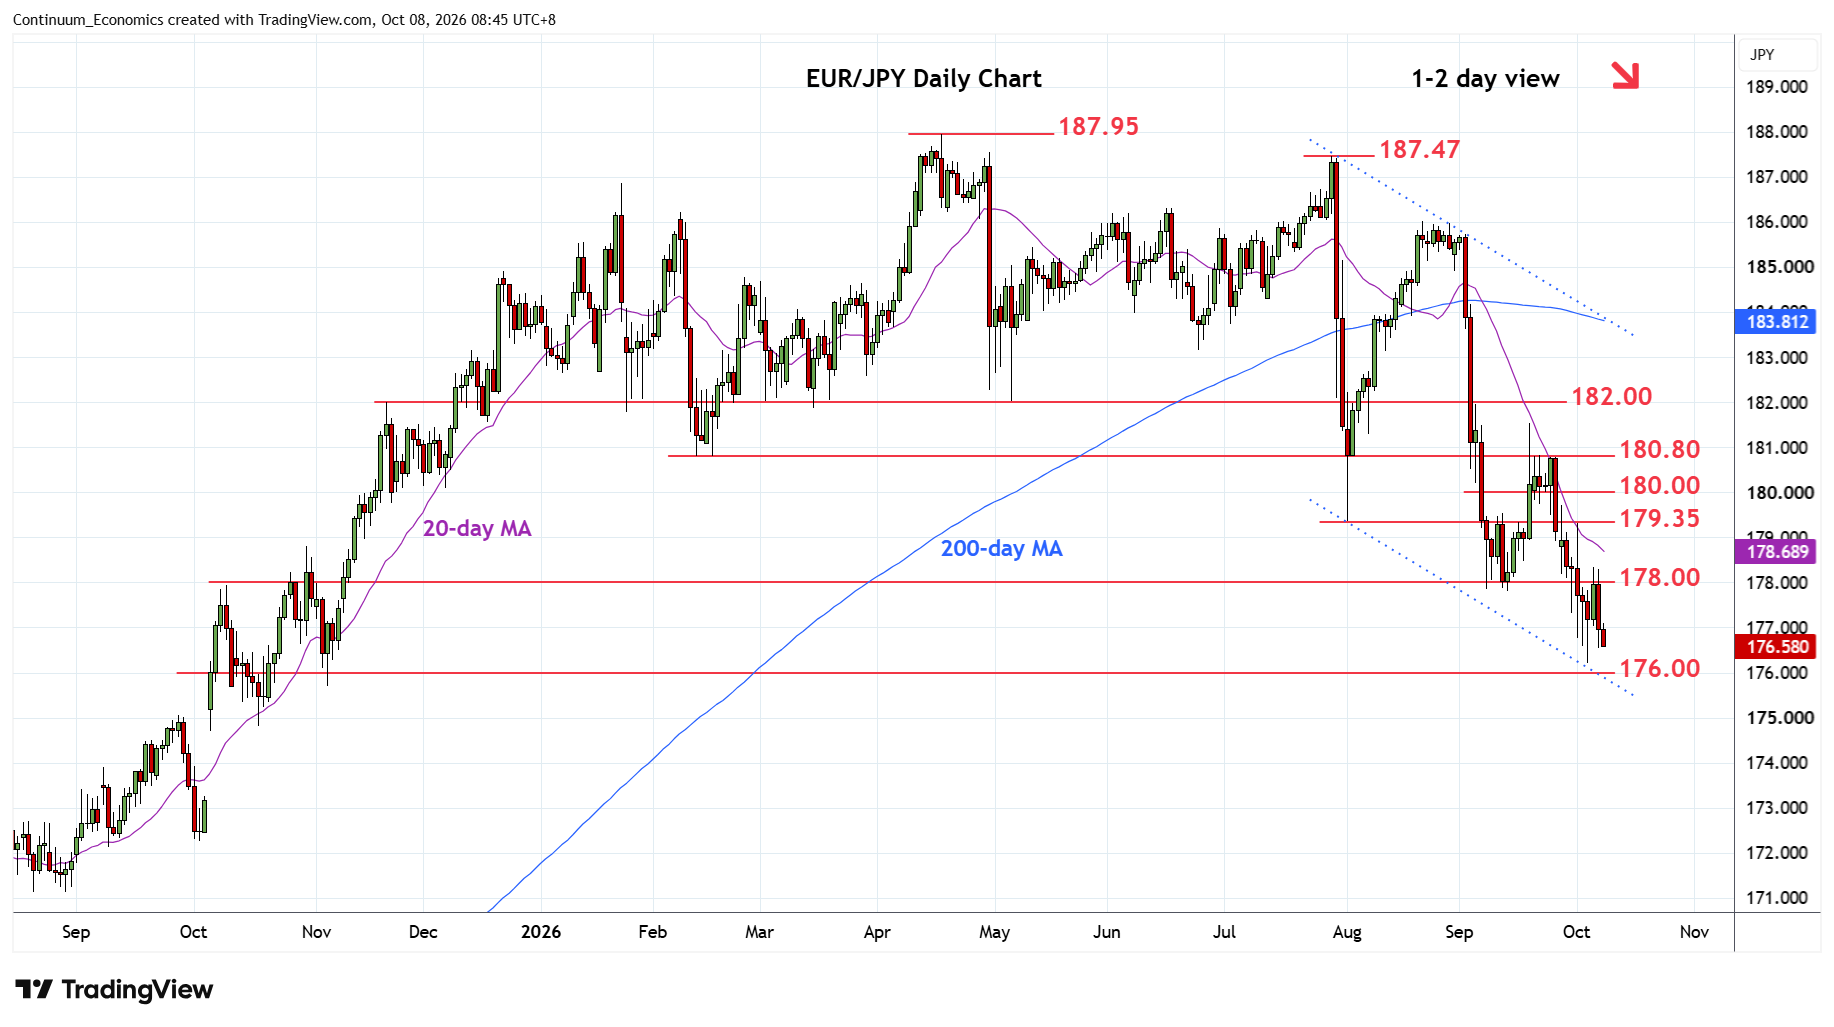
Under pressure after failing to get a foothold above the 178.00
| Levels | Imp | Comment | Levels | Imp | Comment | |||
|---|---|---|---|---|---|---|---|---|
| R4 | 180.80 | ** | Feb low | S1 | 176.21 | ** | 5 Oct YTD low | |
| R3 | 180.00 | * | congestion | S2 | 175.42 | ** | Jul 2024 year high | |
| R2 | 179.35 | ** | Aug low | S3 | 175.30 | * | 38.2% 2025/2026 rally | |
| R1 | 178.00 | * | congestion | S4 | 175.00 | * | congestion |
Asterisk denotes strength of level
00:50 GMT - Under pressure after failing to get a foothold above the 178.00. Rejection from the 178.33 high through the 177.00 level see the 176.21 Monday's current year low and 176.00 channel support back in focus. Would expect reaction here but bearish momemtum threatens break to extend the broader losses from the July high. Below these will see room for extension to strong support at 175.42/30, July 2024 year high and 38.2% Fibonacci retracement. Meanwhile, resistance at the 178.00/33 area expected to cap. Above here will open up room for stronger gains within the bear channel from the July high.