Published: 2026-08-03T00:24:09.000Z
Chart AUD/USD Update: Extending gains
3
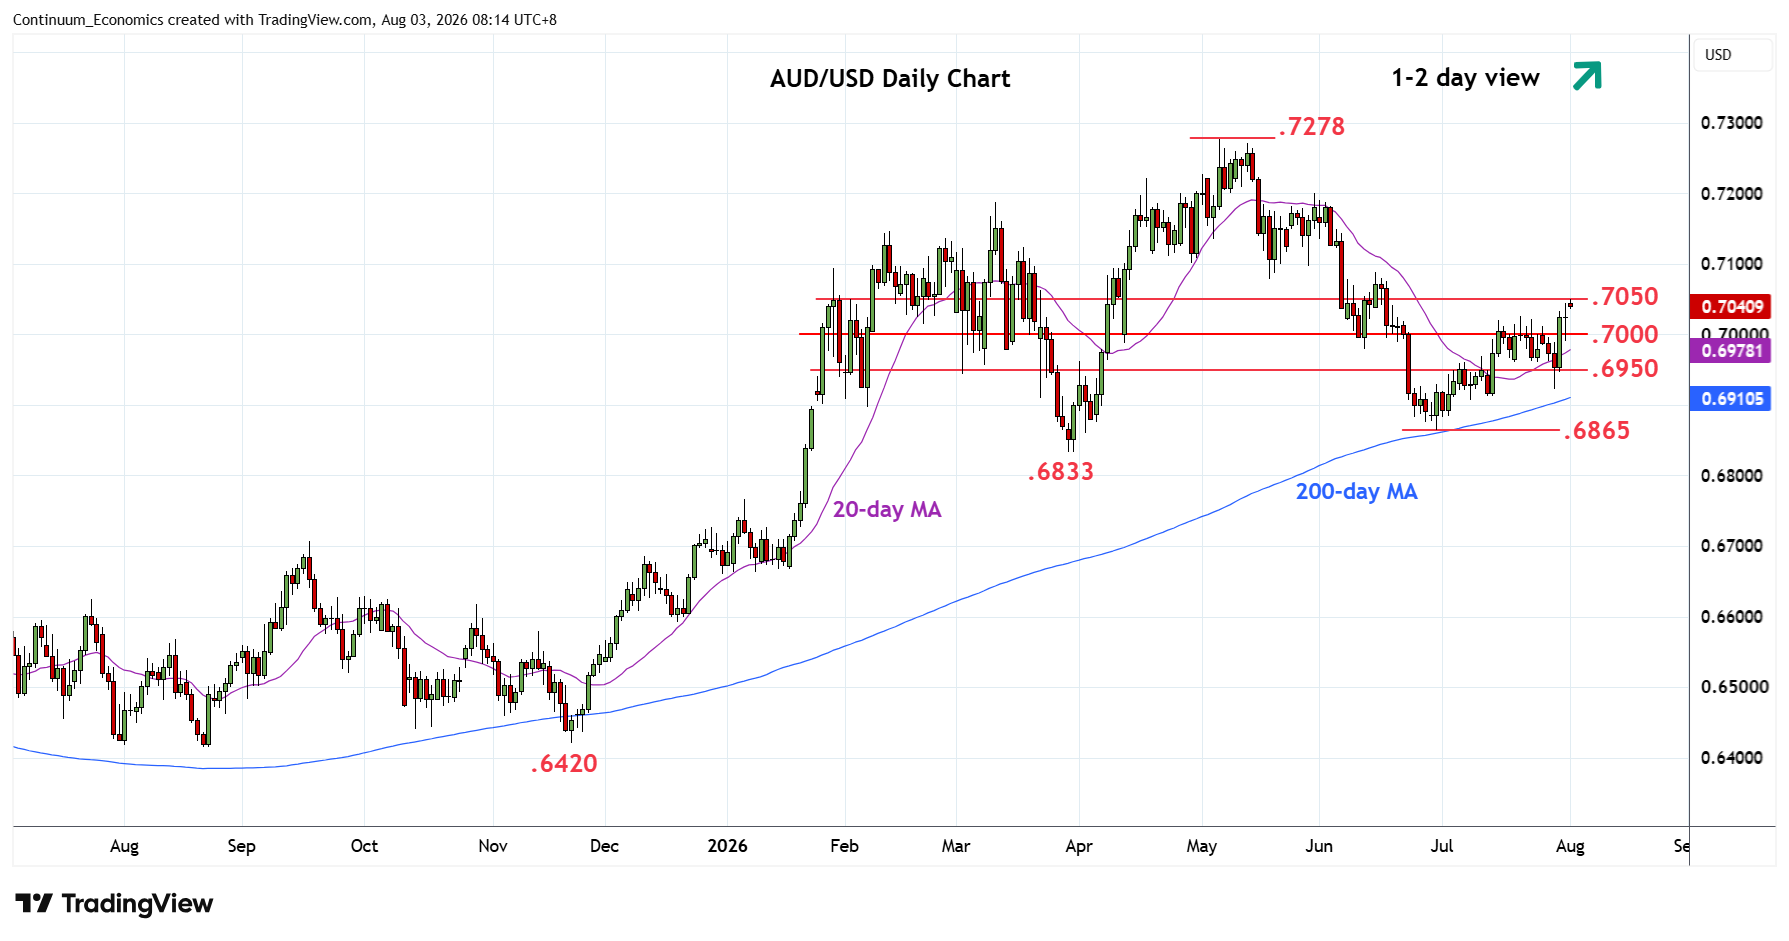
Higher at the open see prices extending gains from the .6922 low of last week to reach resistance at .7050
| Levels | Imp | Comment | Levels | Imp | Comment | |||
|---|---|---|---|---|---|---|---|---|
| R4 | 0.7120 | * | 61.8% May/Jun fall | S1 | 0.7000 | * | figure, congestion | |
| R3 | 0.7100 | ** | congestion | S2 | 0.6950 | * | congestion | |
| R2 | 0.7080 | * | May low | S3 | 0.6922 | ** | 29 Jul low | |
| R1 | 0.7050 | * | congestion | S4 | 0.6900 | * | congestion |
Asterisk denotes strength of level
00:15 GMT - Higher at the open see prices extending gains from the .6922 low of last week to reach resistance at .7050. Positive daily and weekly studies keep pressure on the upside and see room to further retrace the May/June losses to the 50% Fibonacci retracement at .7070. Just above here will see strong resistance coming into play at the .7080/.7100 congestion area. Higher still, will see scope to .7120, 61.8% Fibonacci level. Meanwhile, support at the .7000 level is expected to underpin and sustain gains from the .6922 low of last week.