Published: 2026-06-23T01:07:26.000Z
Chart USD/JPY Update: Pressuring 161.80/95 highs
1
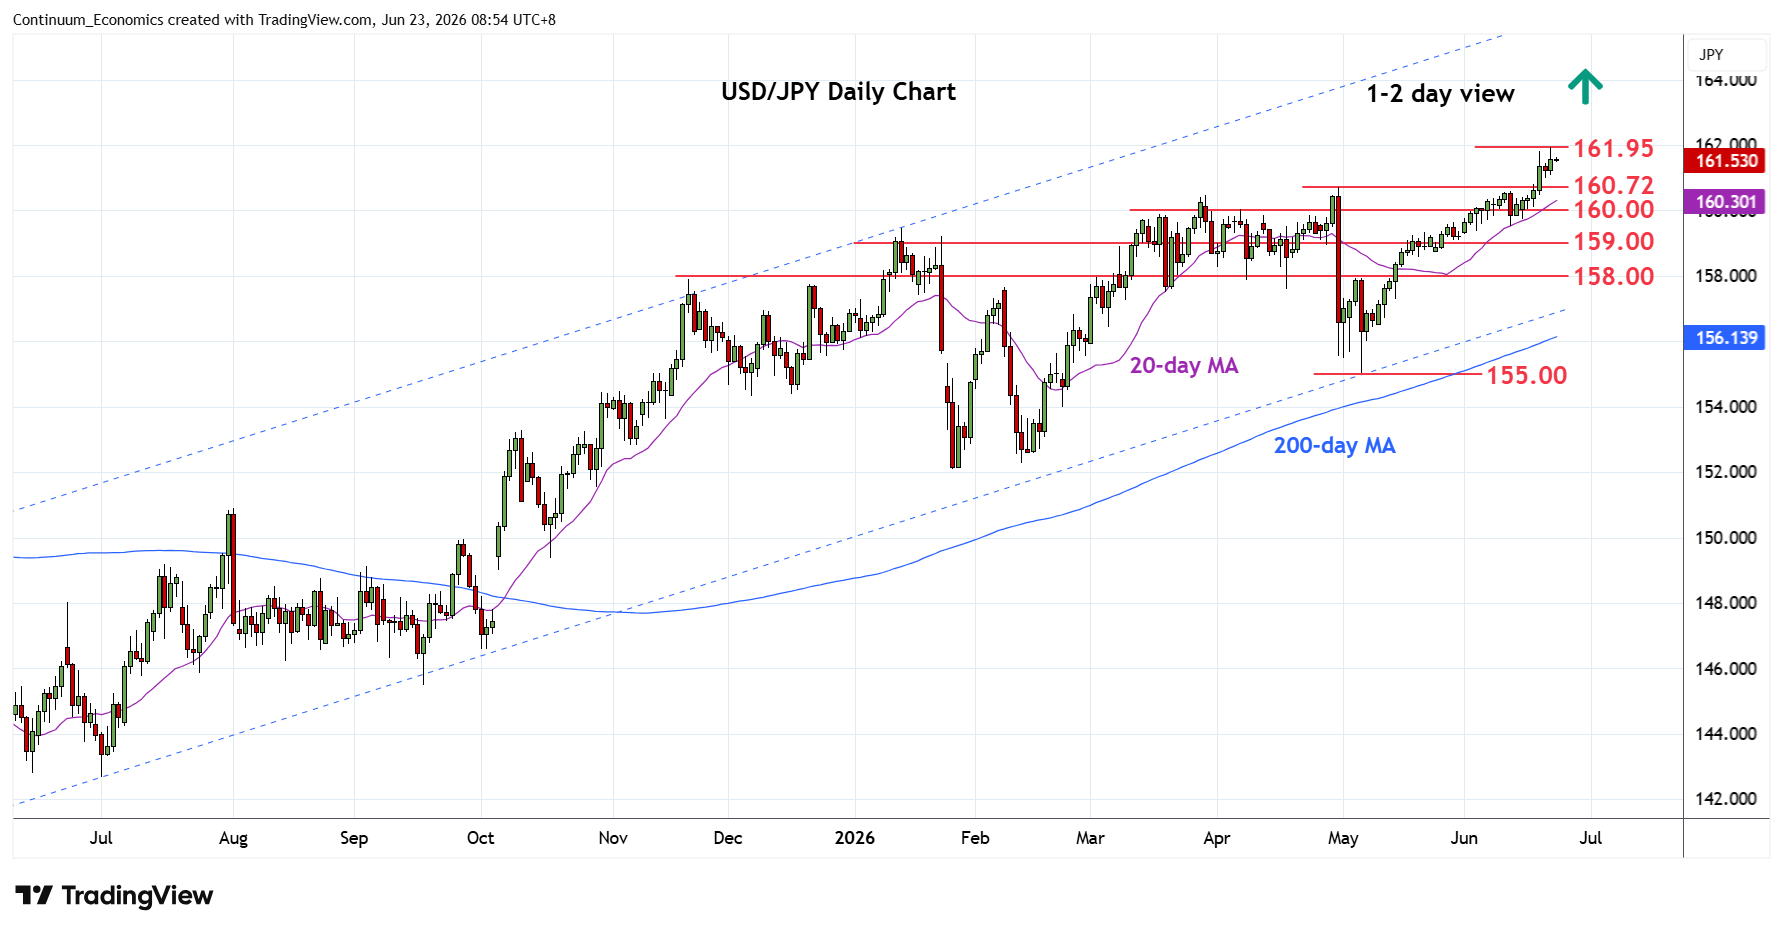
Still pressuring the upside with gains to fresh high above 161.80 falling just shy of the 161.95
| Levels | Imp | Comment | Levels | Imp | Comment | |||
|---|---|---|---|---|---|---|---|---|
| R4 | 164.95 | ** | Nov 1986 high | S1 | 161.00 | * | 19 Jun low | |
| R3 | 164.00 | * | Dec 1986 high | S2 | 160.72 | ** | Apr high | |
| R2 | 163.00 | * | congestion from Dec 1986 | S3 | 160.00 | * | figure | |
| R1 | 161.95 | ** | Jul 2024 multi-year high | S4 | 159.53 | * | 11 Jun low |
Asterisk denotes strength of level
01:00 GMT - Still pressuring the upside with gains to fresh high above 161.80 falling just shy of the 161.95, 2024 multi-year high. However, pressure remains on the upside and see potential for break here to extend bullish gains from the 155.00 May low. Break, if seen, will see room to 163.00/164.00 congestion area and high of December 1986. Meanwhile, support is raised to the 161.00/160.72 area which is expected to underpin. Would take break to eased the upside pressure and open up room for deeper corrective pullback to 160.00/159.53 support.