Chartbook: UK Chart FTSE 100 Update: Turning away from fresh all-time highs
The anticipated test higher has posted a fresh all-time high just shy of 11,000, before settling into multi-week consolidation beneath here.
The anticipated test higher has posted a fresh all-time high just shy of 11,000, before settling into multi-week consolidation beneath here.
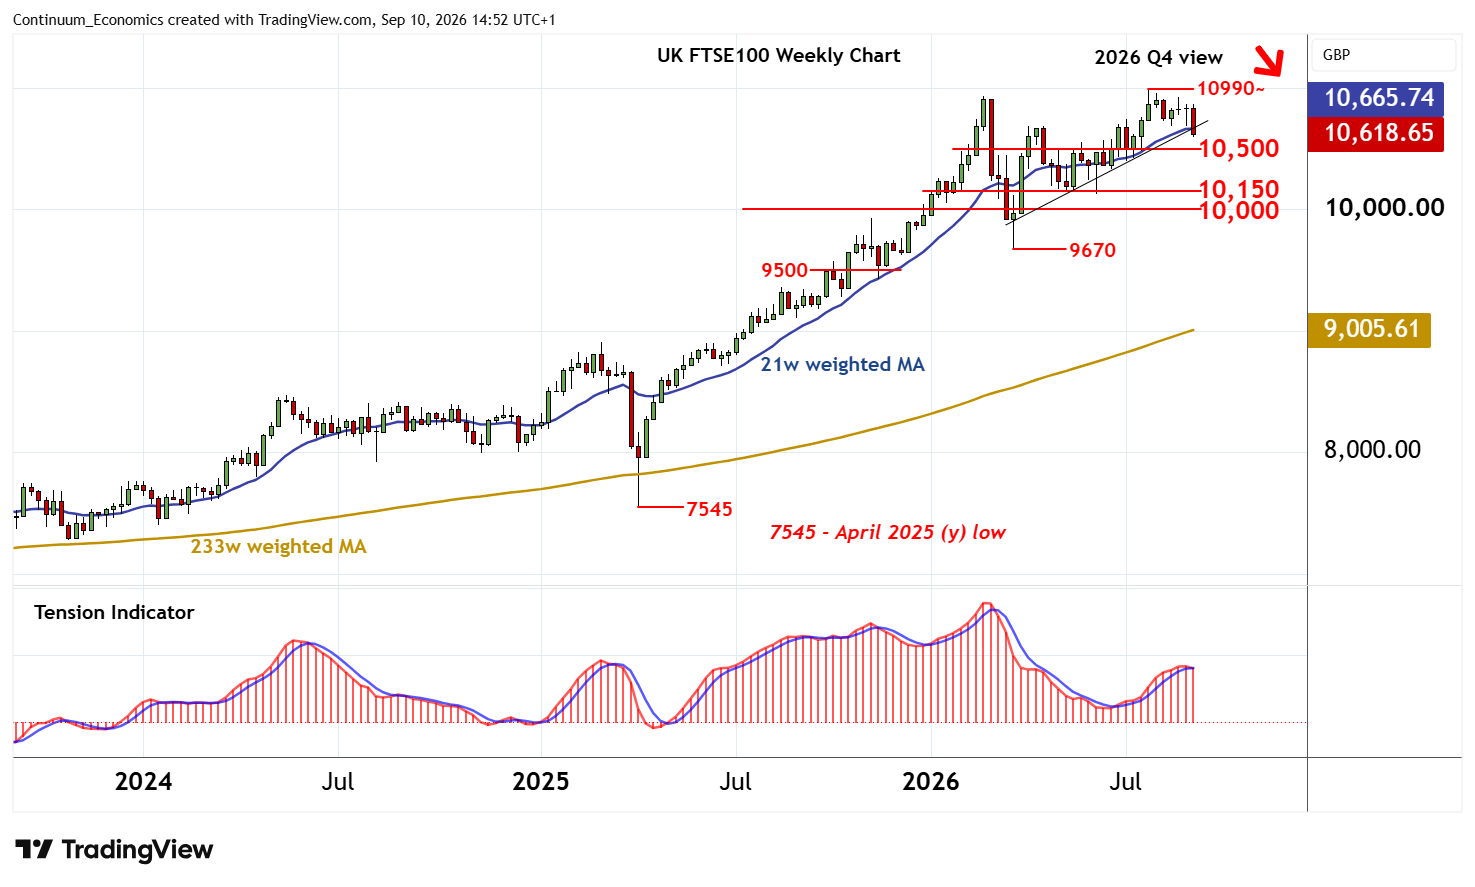
Weekly stochastics are bearish and the flat weekly Tension Indicator is coming under pressure, highlighting profit-taking and room for a pullback into the coming weeks.
Support is at the 10,500 break level. A close beneath here will add weight to sentiment and put prices into congestion above 10,1500. However, deteriorating weekly charts and developing broad JPY strength could weigh on investor sentiment and extend losses still further.
A close below 10,000 would add further weight to sentiment, confirm a significant near-term top in place at the 10,990~ all-time high of 31 July and put focus on the 9670 current year low of 23 March.
Meanwhile, resistance is strong at 10,990 - 11,000.
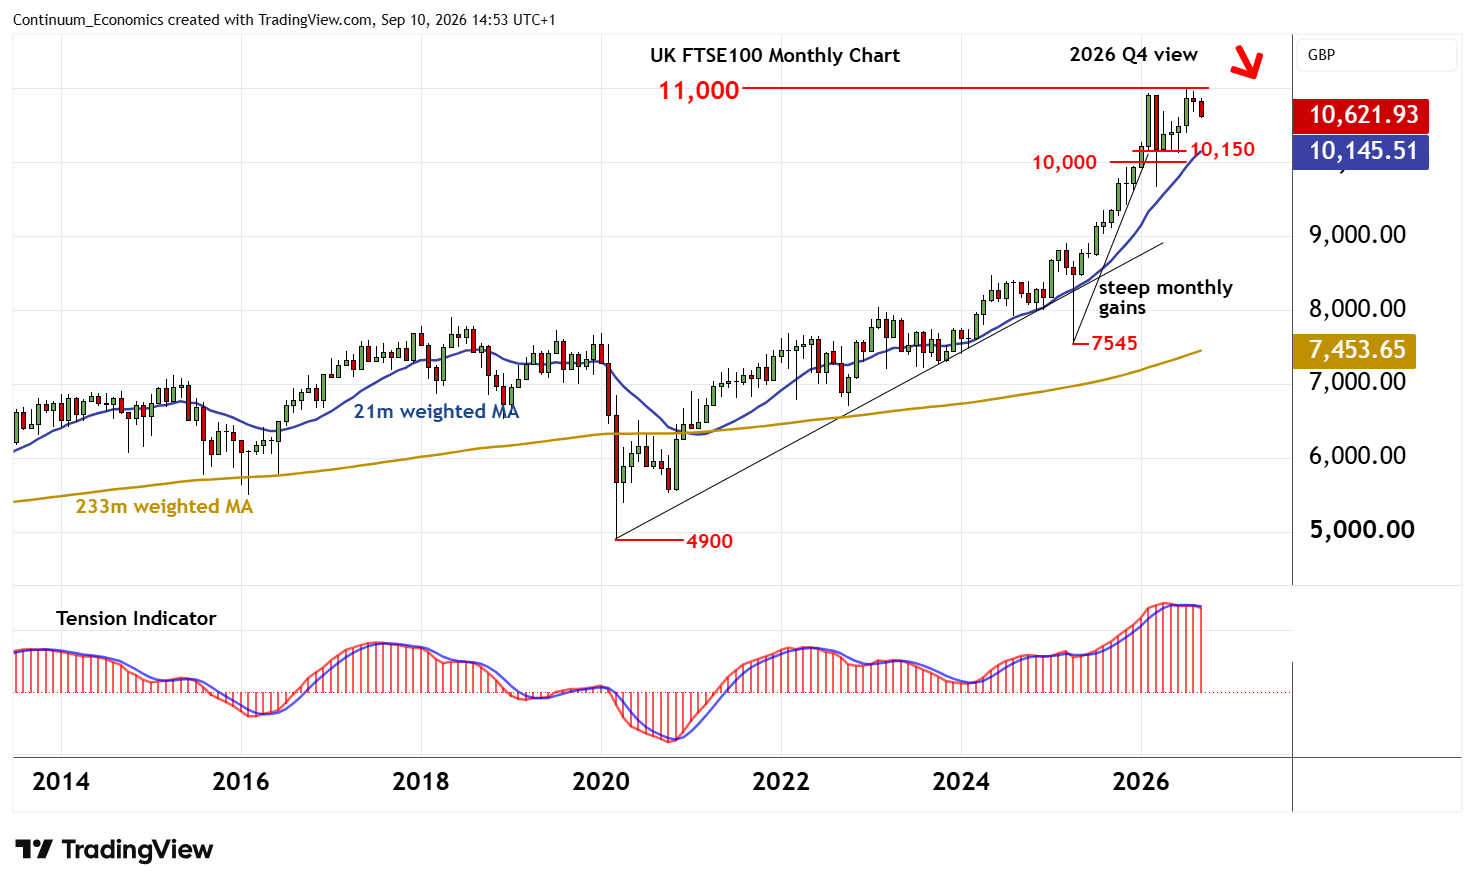
Deteriorating monthly charts should limit any tests in renewed selling interest.
A close above here, however, would turn sentiment positive once again and extend multi-year bull trends into fresh all-time highs.