Published: 2026-10-12T01:03:54.000Z
Chart EUR/JPY Update: Higher in consolidation above 177.00
-
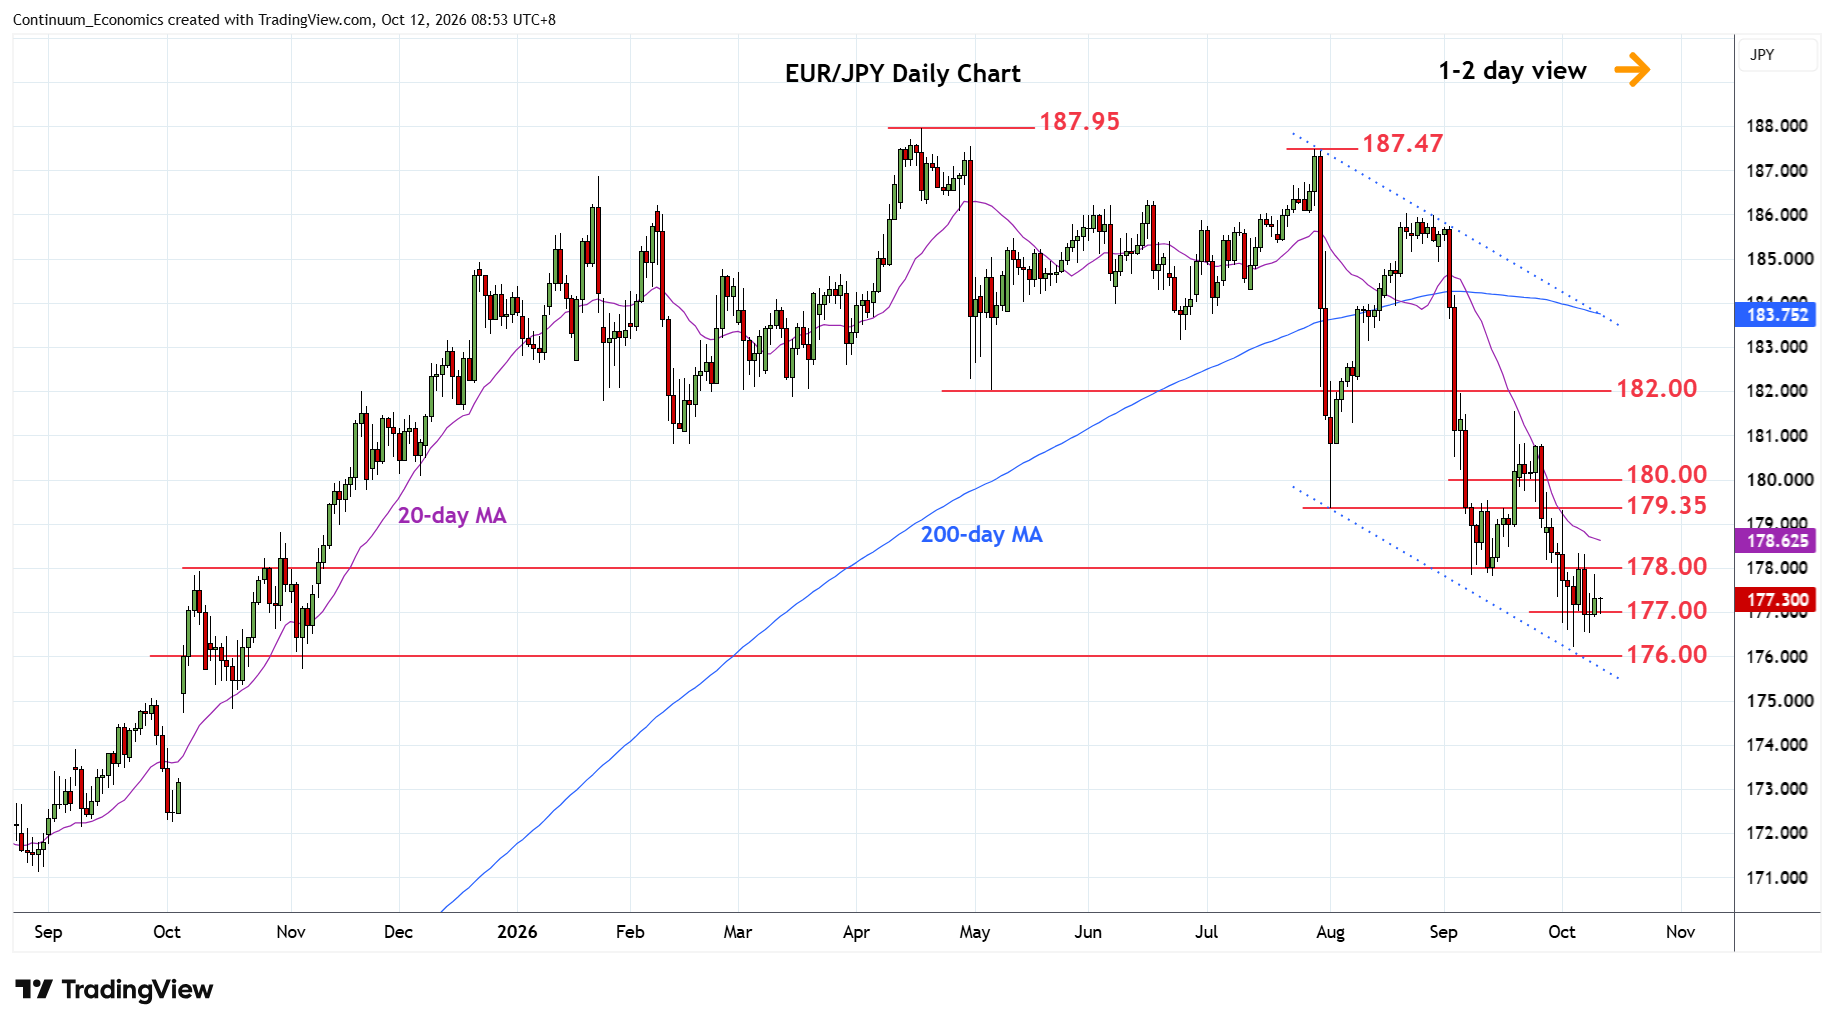
Edged up above the 177.00 level as prices consolidate losses from the 176.21, 5 October current year low
| Levels | Imp | Comment | Levels | Imp | Comment | |||
|---|---|---|---|---|---|---|---|---|
| R4 | 180.80 | ** | Feb low | S1 | 177.00 | congestion | ||
| R3 | 180.00 | * | congestion | S2 | 176.21 | ** | 5 Oct YTD low | |
| R2 | 179.35 | ** | Aug low | S3 | 175.42 | ** | Jul 2024 year high | |
| R1 | 178.00 | * | congestion | S4 | 175.30 | * | 38.2% 2025/2026 rally |
Asterisk denotes strength of level
01:00 GMT - Edged up above the 177.00 level as prices consolidate losses from the 176.21, 5 October current year low. Daily studies are mixed at oversold areas and suggest ranging action tracing out a small base pattern ahead of stronger bounce to correct recent losses from the 181.55, 18 September swing high. Break above the 178.00 resistance will open up room to strong resistance at the 179.35 August low which is expected to cap. Meanwhile, a later break of the 176.21 low and 176.00 level will see room for extension to strong support at 175.42/30, July 2024 year high and 38.2% Fibonacci retracement.