Published: 2026-07-31T01:15:30.000Z
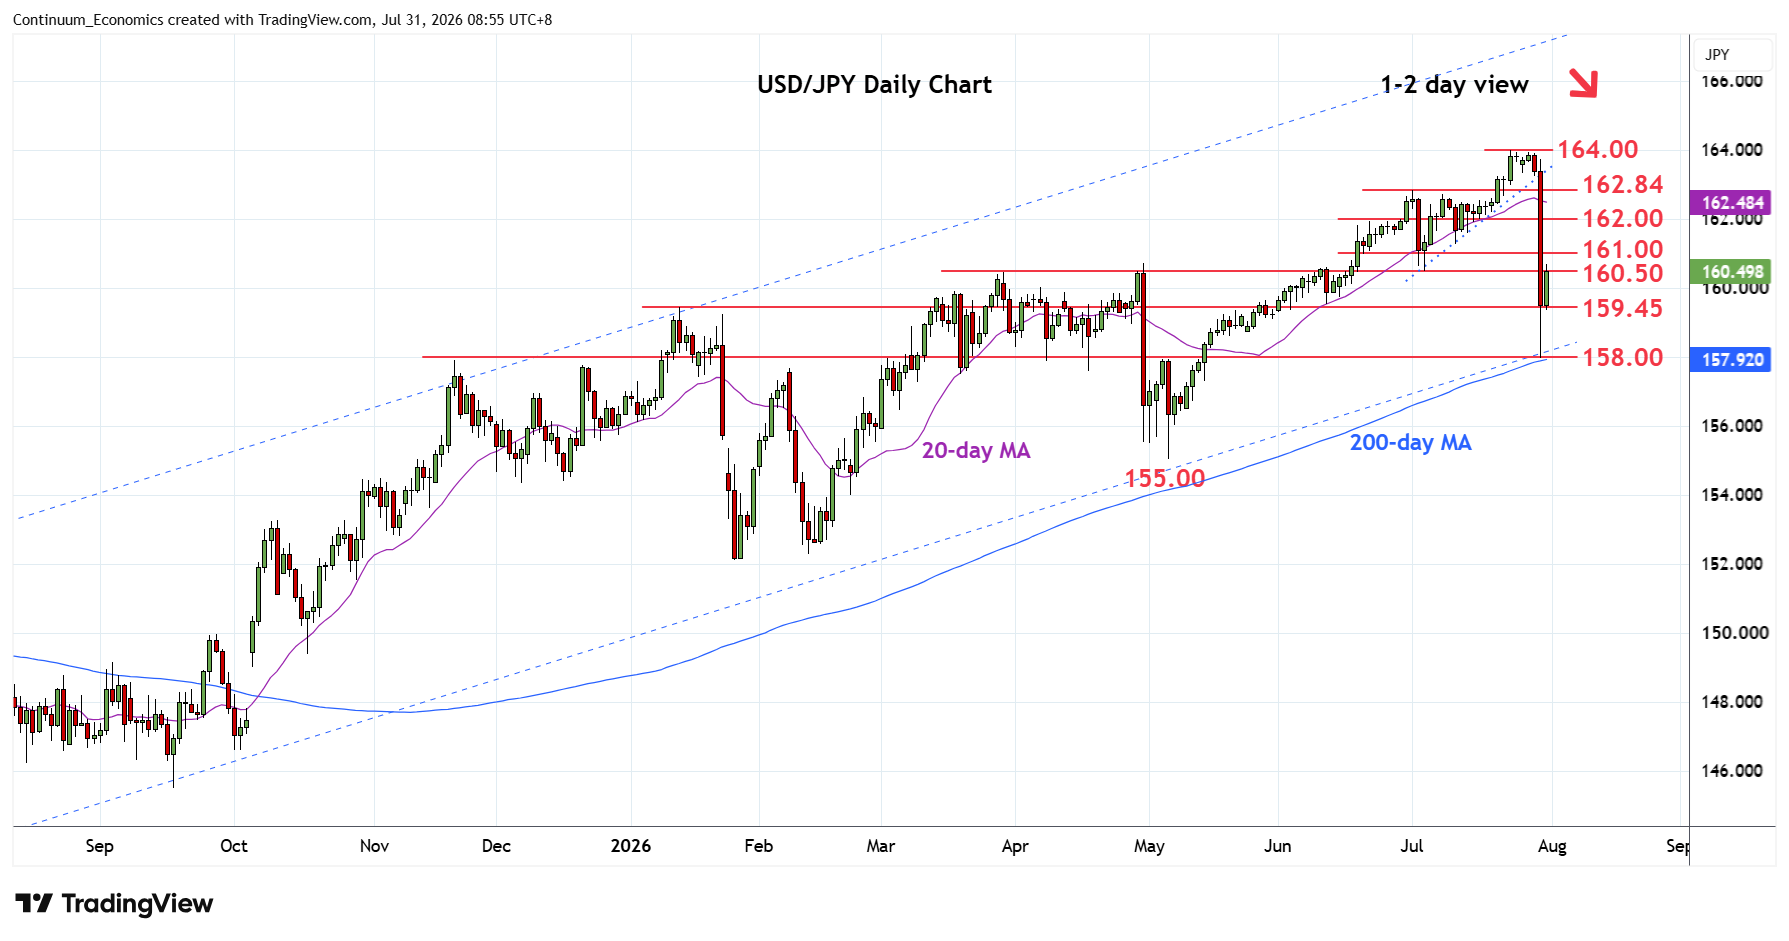
Chart USD/JPY Update: Consolidating plunge to 158.00
5
Break of support at the 163.24/162.84 area saw sharp plunge to reach the April channel and 200-day MA at the 158.00 level
| Levels | Imp | Comment | Levels | Imp | Comment | |||
|---|---|---|---|---|---|---|---|---|
| R4 | 162.84 | ** | 1 Jul high | S1 | 159.45 | * | 21 Jul high | |
| R3 | 162.00 | * | congestion | S2 | 157.95 | ** | 30 Jul low | |
| R2 | 161.00/28 | * | figure, 10 Jul low | S3 | 157.10 | * | 76.4% May/Jul rally | |
| R1 | 160.50 | * | congestion | S4 | 156.00 | * | congestion |
Asterisk denotes strength of level
01:00 GMT - Break of support at the 163.24/162.84 area saw sharp plunge to reach the April channel and 200-day MA at the 158.00 level. Prices has since turned up to consolidate above the 159.45 support with bounce reaching resistance at 160.50. Higher still, if seen, will see scope to resistance at the 161.00/28 area and possibly 162.00. Consolidation is expected to give way to renewed selling pressure later with support now raised to the 159.45/159.00 area ahead of 157.95 low.