Published: 2026-06-22T08:03:17.000Z
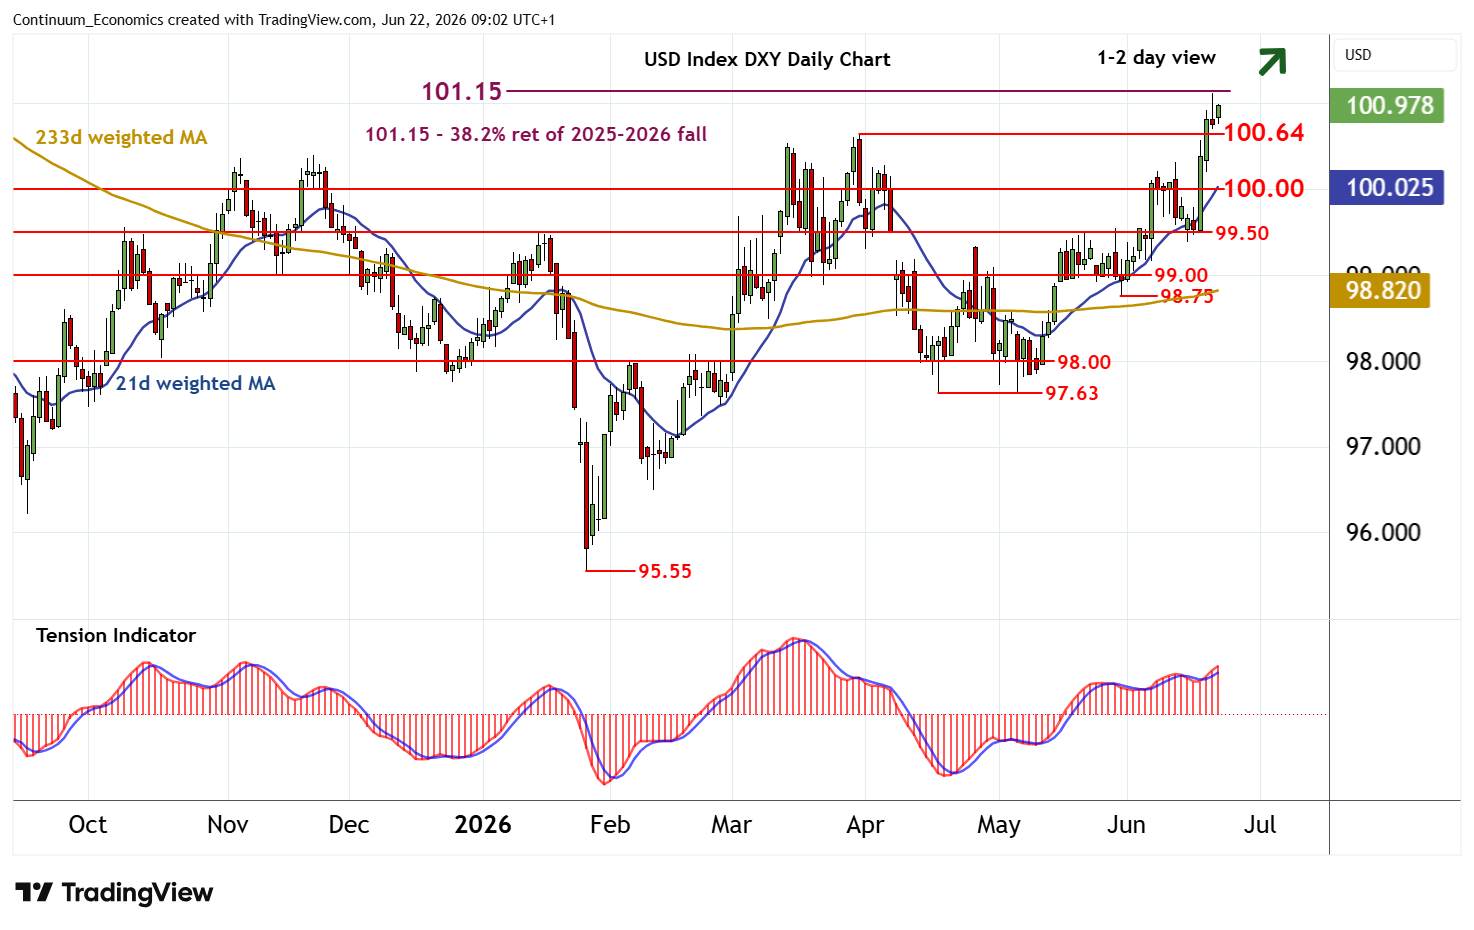
Chart USD Index DXY Update: Focus back on strong resistance at the 101.15 Fibonacci retracement
1
Cautious trade above support at the 100.64 monthly high of 31 March is giving way to a fresh push higher
| Levels | Imp | Comment | Levels | Imp | Comment | |||
|---|---|---|---|---|---|---|---|---|
| R4 | 103.00 | minor congestion | S1 | 100.64 | ** | 31 Mar (m) high | ||
| R3 | 102.85 | ** | 50% ret of 2025-2026 fall | S2 | 100.00 | ** | congestion | |
| R2 | 102.00 | ** | congestion | S3 | 99.50 | * | congestion | |
| R1 | 101.15 | ** | 38.2% ret of 2025-2026 fall | S4 | 99.00 | * | congestion |
Asterisk denotes strength of level
08:55 BST - Cautious trade above support at the 100.64 monthly high of 31 March is giving way to a fresh push higher, with prices approaching strong resistance at the 101.13 current year high of 19 June and the 101.15 Fibonacci retracement. Daily readings are rising and broader weekly charts are also positive, highlighting room for a later break above here. A close above 101.15 will improve sentiment and extend January gains initially towards congestion around 102.00. Meanwhile, a close below 100.64, if seen, will turn sentiment neutral and give way to consolidation above congestion support at 100.64.