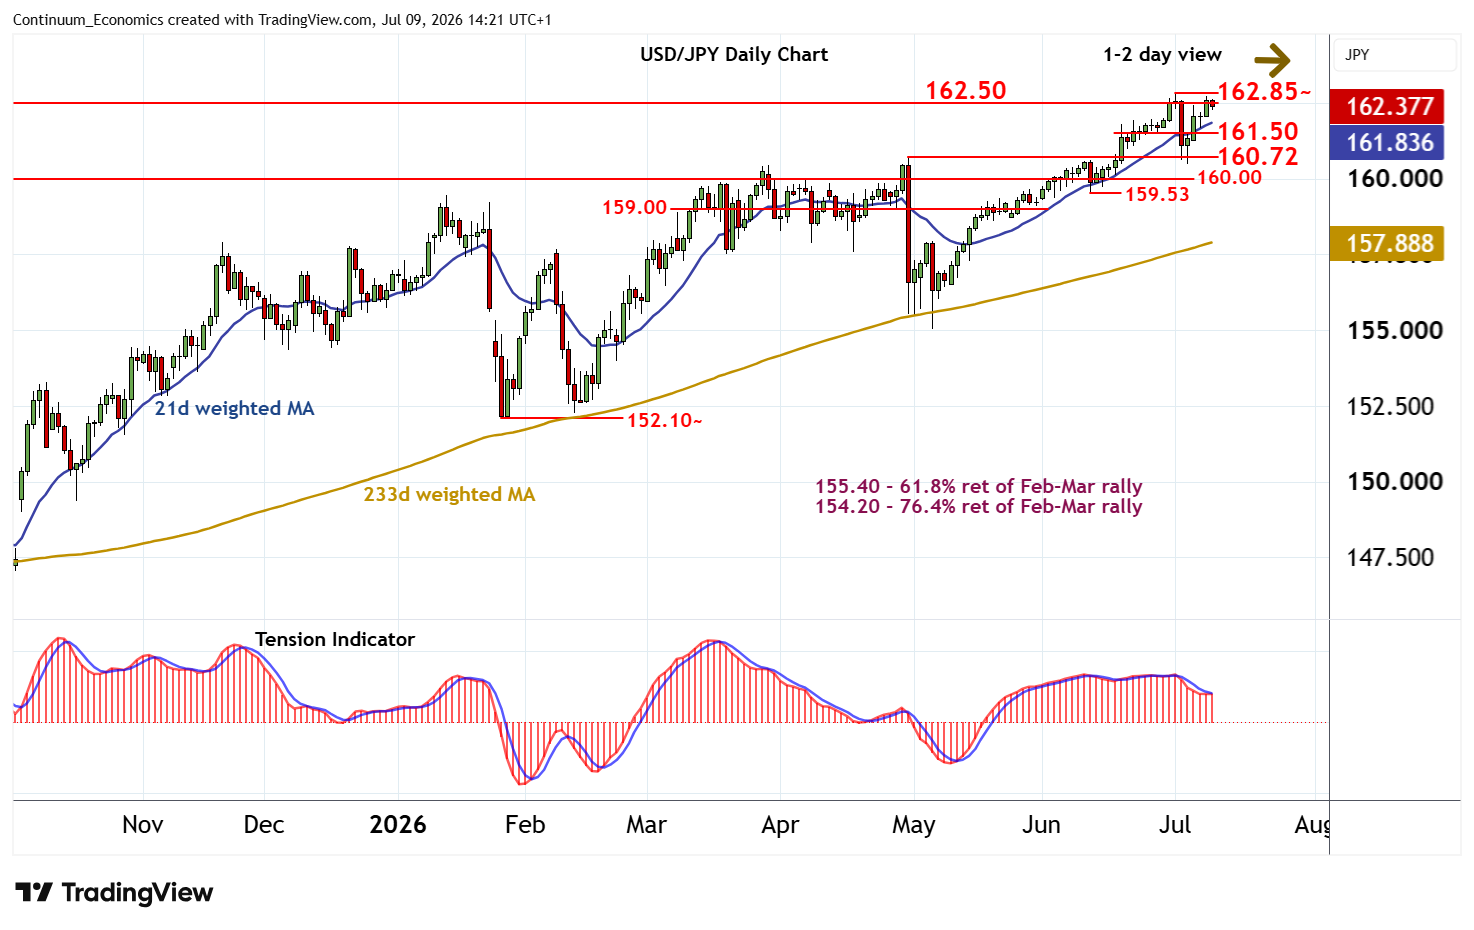
Chart USD/JPY Update: Balanced at highs
The test above 162.50 has been pushed back from 162.70
| Levels | Imp | Comment | Levels | Imp | Comment | |||
|---|---|---|---|---|---|---|---|---|
| R4 | 163.95 | ** | December 1986 high | S1 | 161.50 | * | intraday break level | |
| R3 | 163.00 | * | historic congestion | S2 | 161.00 | * | intraday lows | |
| R2 | 162.85~ | ** | 1 July multi-year high | S3 | 160.72 | * | 30 Apr (m) high | |
| R1 | 162.50 | historic congestion | S4 | 160.00 | ** | congestion |
Asterisk denotes strength of level
13:55 BST - The test above 162.50 has been pushed back from 162.70, as intraday studies turn down, with prices once again trading below 162.50. A pullback towards 162.00 is possible. But mixed daily readings and positive weekly charts should limit any deeper losses in renewed buying interest/consolidation above 161.50. Following cautious/corrective trade, fresh gains are looked for. However, a close above critical resistance at the 162.85~ multi-year high of 1 July is needed to turn sentiment positive and extend long-term gains beyond 163.00 towards the 163.95 high of December 1986. Meanwhile, a close below 161.50, if seen, will open up the 160.72 monthly high of 30 April, where renewed buying interest/consolidation is expected to appear.