Published: 2026-06-23T01:39:47.000Z
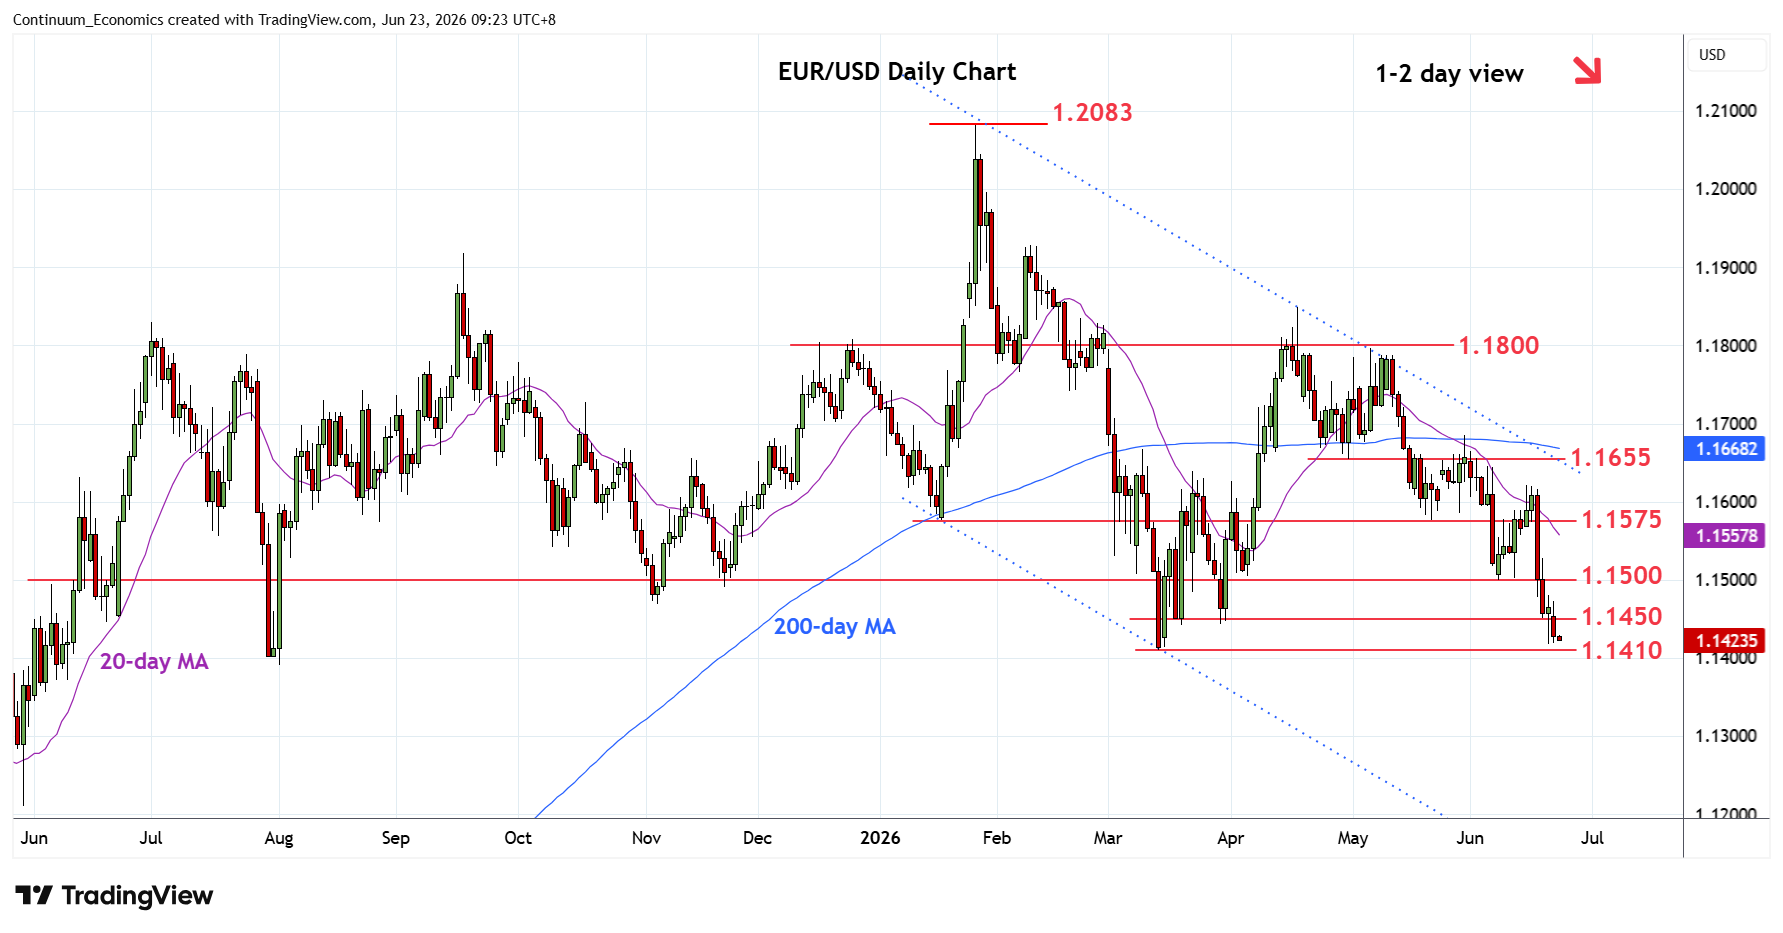
Chart EUR/USD Update: Consolidating above 1.1410/00 support
-
Range-bound above the 1.1418 Friday's low as prices consolidate losses from 1.1620 high
| Levels | Imp | Comment | Levels | Imp | Comment | |||
|---|---|---|---|---|---|---|---|---|
| R4 | 1.1600/20 | * | congestion, 15 Jun high | S1 | 1.1410 | ** | 13 Mar YTD low | |
| R3 | 1.1550/75 | ** | congestion, May low | S2 | 1.1400 | * | figure | |
| R2 | 1.1500 | ** | 8 Jun low | S3 | 1.1355 | * | 38.2% 2025/2026 rally | |
| R1 | 1.1450 | congestion | S4 | 1.1300 | congestion |
Asterisk denotes strength of level
01:30 GMT - Range-bound above the 1.1418 Friday's low as prices consolidate losses from 1.1620 high and unwind oversold intraday studies. Both daily and weekly studies are stretched as well and suggest reaction likely on test of the 1.1410/00 support. However, a later break cannot be ruled out to extend the January losses to 1.1355, 38.2% Fibonacci level. Meanwhile, resistance starts at 1.1450 congestion and this extend to the 1.1500 congestion and 8 June low which is expected to cap. Above here will ease the downside pressure and open up room for stronger bounce to the 1.1550/75 area.