Chart EUR/SEK Update: Turning away from fresh year highs
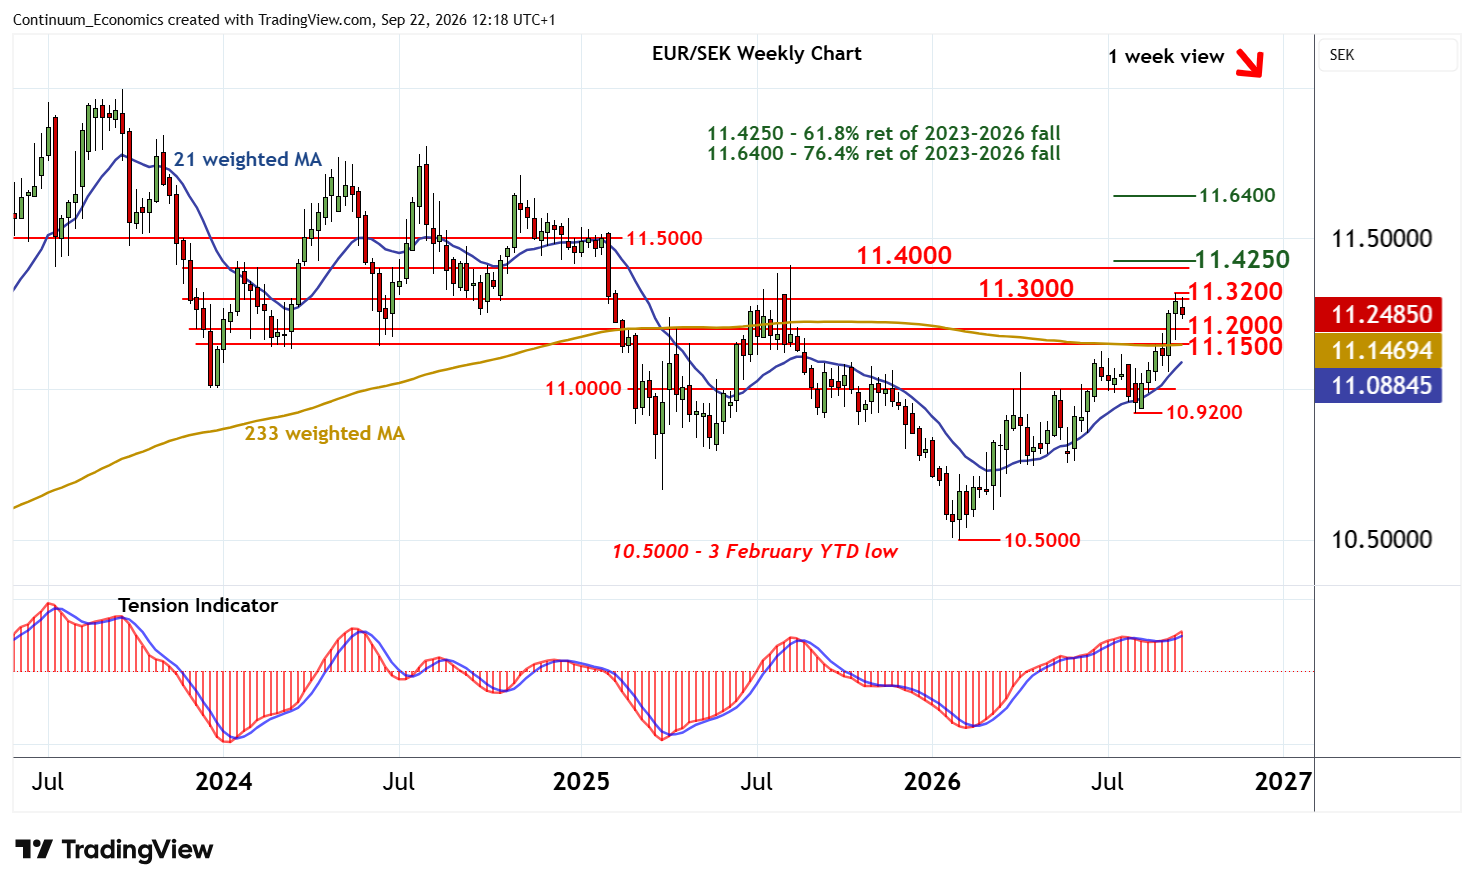
The anticipated break above congestion resistance at 11.3000 has been pushed back from 11.3200
| Levels | Imp | Comment | Levels | Imp | Comment | |||
| R4 | 11.4250 | ** | 61.8% ret of 2023-2026 fall | S1 | 11.2000 | ** | congestion | |
| R3 | 11.4000 | ** | congestion | S2 | 11.1500 | * | congestion | |
| R2 | 11.3200 | * | 16 Sep YTD high | S3 | 11.1000 | * | congestion | |
| R1 | 11.3000 | * | congestion | S4 | 11.0000 | ** | break level |
Asterisk denotes strength of level
11:30 BST - The anticipated break above congestion resistance at 11.3000 has been pushed back from 11.3200, as both daily stochastics and the daily Tension Indicator turn down. Consolidation is giving way to fresh losses towards congestion support at 11.2000. Overbought weekly stochastics are also ticking lower, suggesting room for a break beneath here. But the positive weekly Tension Indicator and mixed/positive longer-term charts should limit any immediate break in renewed consolidation above further congestion around 11.1500.
Meanwhile, resistance remains at 11.3000 and extends to the 11.3200 current year high of 16 September. A close above here is needed to turn sentiment positive once again, and extend gains from the 10.5000 current year low of 3 February towards congestion around 11.4000 and the 11.4250 Fibonacci retracement.