Chart USD Index DXY Update: Consolidating test of 98.60 - studies under pressure
Choppy trade following the test of congestion resistance at 99.00 has given way to a pullback
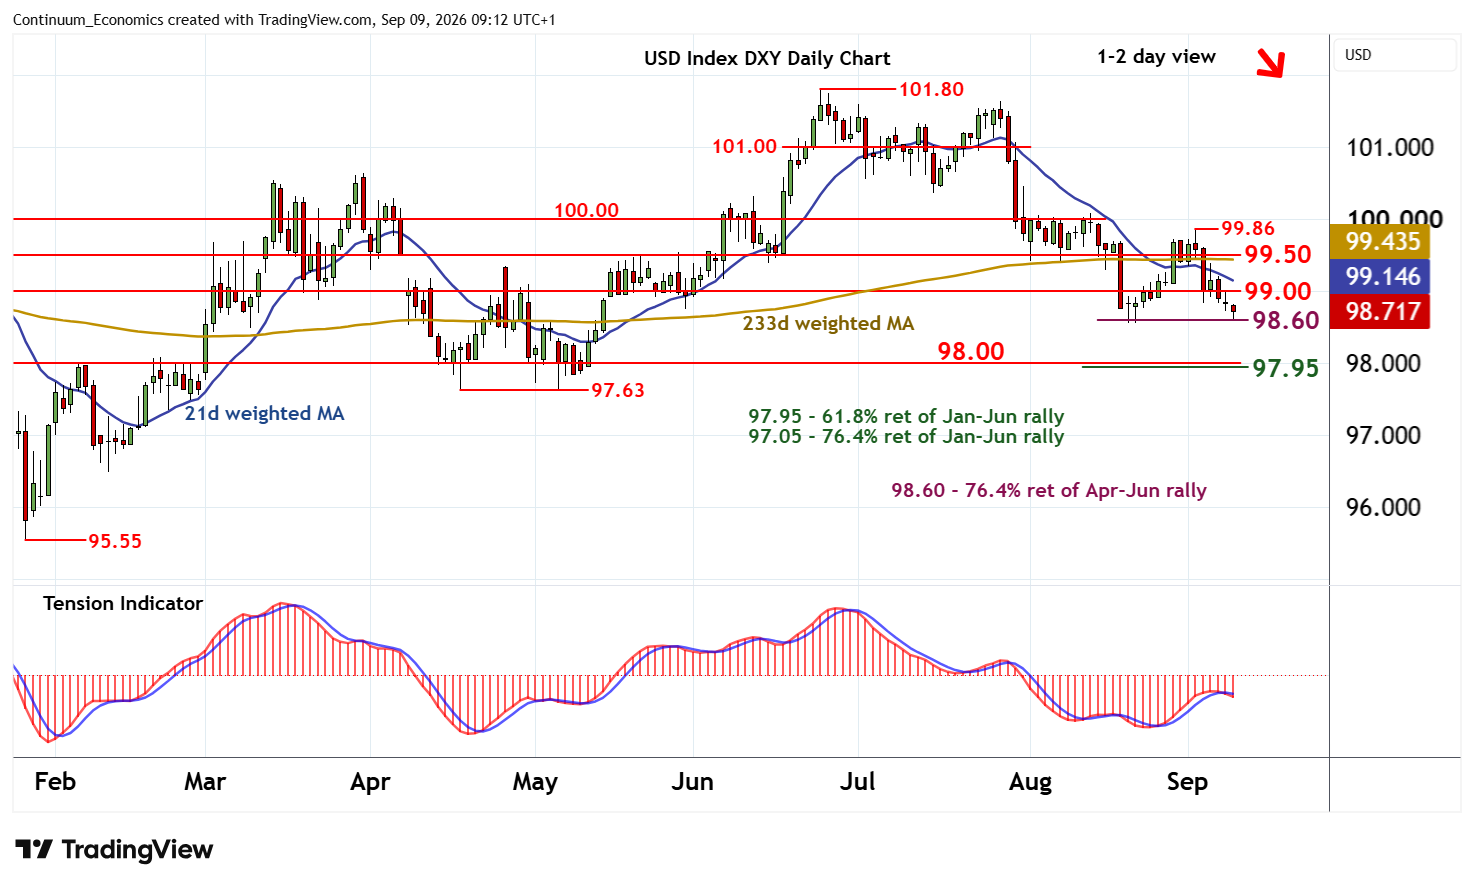
| Levels | Imp | Comment | Levels | Imp | Comment | |||
|---|---|---|---|---|---|---|---|---|
| R4 | 100.00 | ** | congestion | S1 | 98.60 | ** | 76.4% ret of Apr-Jun rally | |
| R3 | 99.50 | ** | congestion | S2 | 97.95/00 | ** | 61.8% ret; congestion | |
| R2 | 99.20 | minor congestion | S3 | 97.63 | ** | 17 Apr - 6 May (m) lows | ||
| R1 | 99.00 | ** | congestion | S4 | 97.50 | ** | congestion |
Asterisk denotes strength of level
09:05 BST - Choppy trade following the test of congestion resistance at 99.00 has given way to a pullback, as intraday studies turn down, with prices currently consolidating the test of strong support at the 98.60 Fibonacci retracement. Daily readings have turned down and broader weekly charts are under pressure, highlighting room for further losses in the coming sessions. A close beneath here will add weight to sentiment and extend late-June losses towards strong support within the 97.95 retracement and congestion around 98.00.
Meanwhile, resistance remains at 99.00 and extends to 99.20. A close above here, if seen, will help to stabilise price action and prompt consolidation beneath further congestion around 99.50.