Published: 2026-06-25T00:44:17.000Z
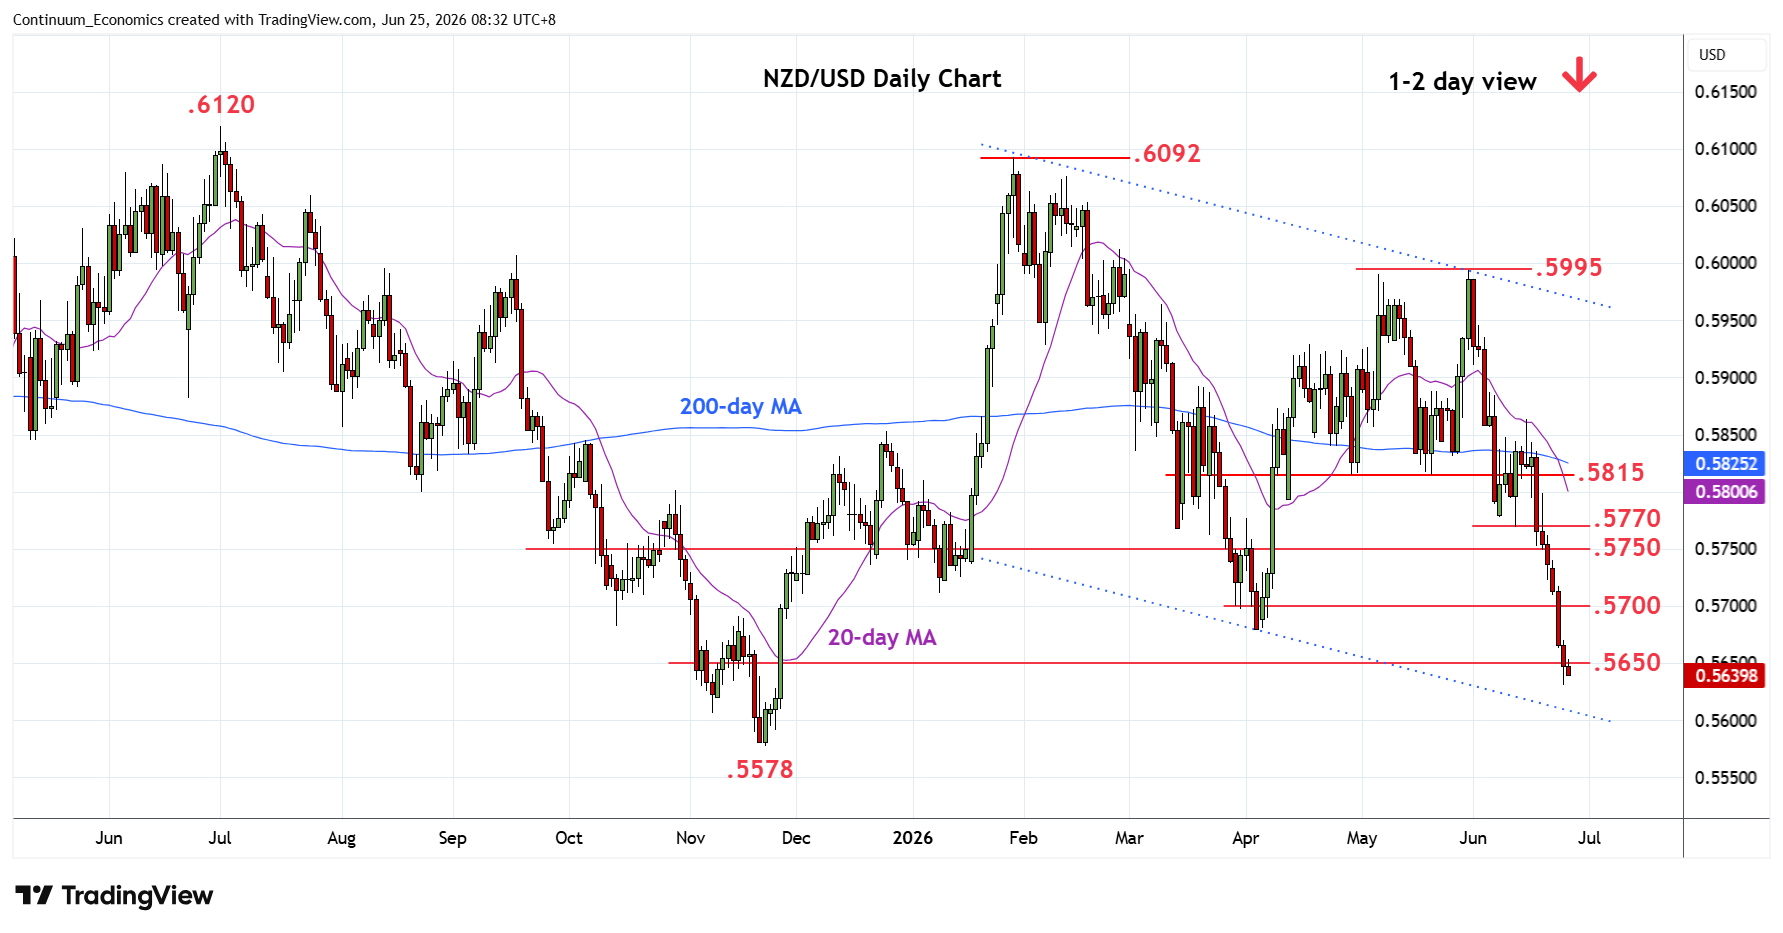
Chart NZD/USD Update: Consolidating at .5630 fresh year low
-
Break below .5650 congestion has seen losses to reach fresh year low at .5630
| Levels | Imp | Comment | Levels | Imp | Comment | |||
|---|---|---|---|---|---|---|---|---|
| R4 | .5770 | ** | 11 Jun low | S1 | .5630 | * | 24 Jun YTD low | |
| R3 | .5750 | * | congestion | S2 | .5600 | * | congestion | |
| R2 | .5700 | * | congestion | S3 | .5578 | ** | Nov low | |
| R1 | .5680 | * | Apr low | S4 | .5550 | congestion |
Asterisk denotes strength of level
00:40 GMT - Break below .5650 congestion has seen losses to reach fresh year low at .5630. Consolidation here see prices unwinding oversold intraday studies but pressure remains on the downside and lower will see room for extension to .5600 then the .5578 low of November. Would expect reaction at these levels as daily and weekly studies extend into oversold areas. Meanwhile, resistance remains at the .5680/.5700 April low and congestion area. Would need to regain this to ease the downside pressure and see room for stronger bounce to .5750/70 resistance.