Monthly US Chart 10 Year Yield: Fresh year highs - studies rising
Consolidation has given way to a push higher to fresh year highs, with yields completing a multi-month triangle/pennant pattern as focus turns to strong resistance at the 4.809% year high of January 2025.
Consolidation has given way to a push higher to fresh year highs, with yields completing a multi-month triangle/pennant pattern as focus turns to strong resistance at the 4.809% year high of January 2025.
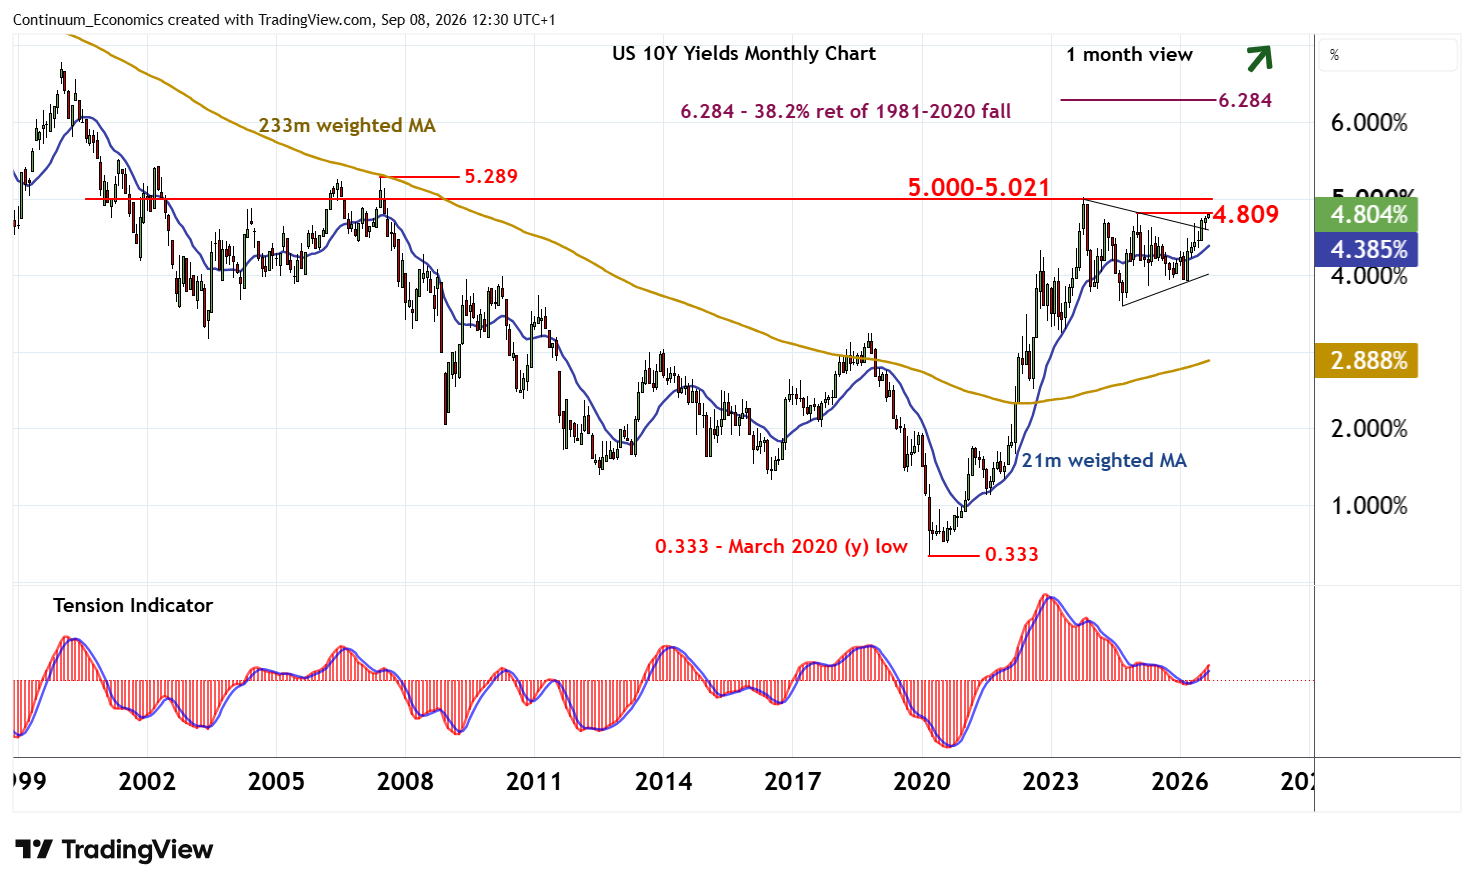
The monthly Tension Indicator is rising, highlighting room for continuation beyond here towards critical resistance at congestion around 5.000% and the 5.021% multi-year high of October 2023. But monthly stochastics are flat in overbought areas, suggesting any initial tests could give way to consolidation. Longer-term charts are showing signs of improvement. But a close above here would turn sentiment positive and confirm continuation of the rise from the 0.333% multi-year low of March 2020.
Meanwhile, support is at multi-week congestion within the 4.600% - 4.750% range.
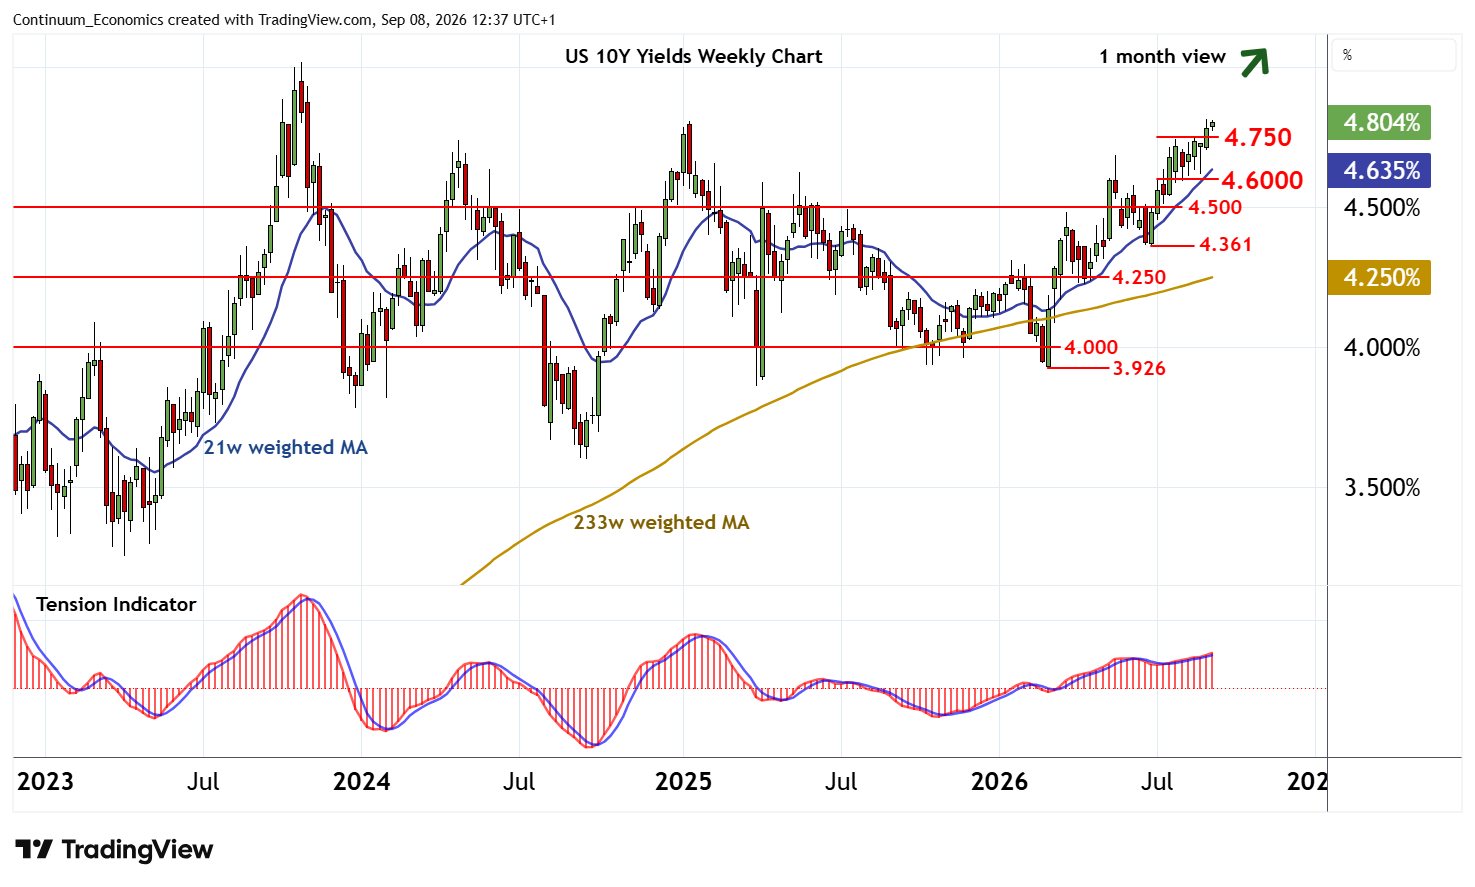
Rising weekly stochastics and the positive weekly Tension Indicator should limit any pullbacks into consolidation within here.
However, a close below the 4.600% congestion lows will add weight to sentiment and open up congestion around 4.500%, where fresh consolidation is expected to appear.