Chart EUR/USD Update: Balanced above fresh year low - studies under pressure
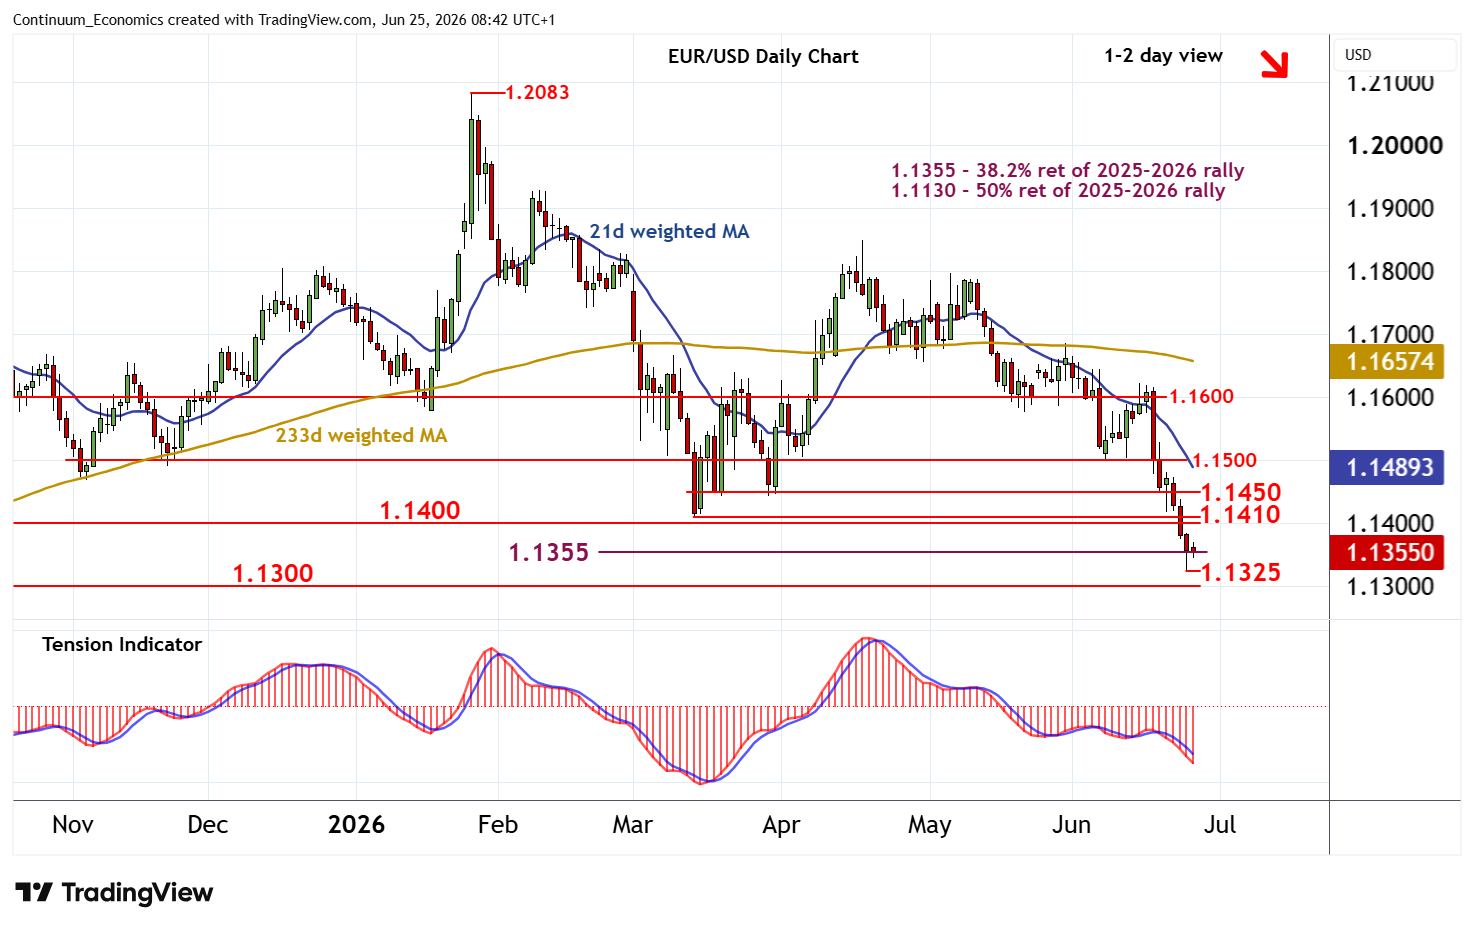
Anticipated losses have tested below the 1.1355 Fibonacci retracement to post a fresh year low at 1.1325
| Levels | Imp | Comment | Levels | Imp | Comment | |||
|---|---|---|---|---|---|---|---|---|
| R4 | 1.1550 | * | congestion | S1 | 1.1355 | ** | 38.2% ret of 2025-2026 rally | |
| R3 | 1.1500 | ** | congestion | S2 | 1.1325 | 24 Jun YTD low | ||
| R2 | 1.1450 | * | congestion | S3 | 1.1300 | ** | congestion | |
| R1 | 1.1400/10 | ** | congestion; 13 Mar (m) low | S4 | 1.1200 | ** | congestion |
*Asterisk denotes strength of level
08:35 BST - Anticipated losses have tested below the 1.1355 Fibonacci retracement to post a fresh year low at 1.1325, before bouncing back into consolidation around 1.1355. Oversold daily stochastics are showing early signs of flattening, suggesting potential for consolidation around here. But the daily Tension Indicator continues to track lower and broader weekly charts are bearish, pointing to room for fresh losses in the coming sessions. A close beneath 1.1355 will add weight to sentiment and extend January losses initially towards congestion from March-May 2025 around 1.1300. Meanwhile, resistance remains at 1.1400/10. A close above here, if seen, would help to stabilise sentiment and prompt consolidation beneath congestion around 1.1450.