Chart USD/CAD Update: Balanced at resistance - background studies remain positive
Anticipated gains have reached resistance at the 1.3985 Fibonacci retracement and the 1.4000 break level
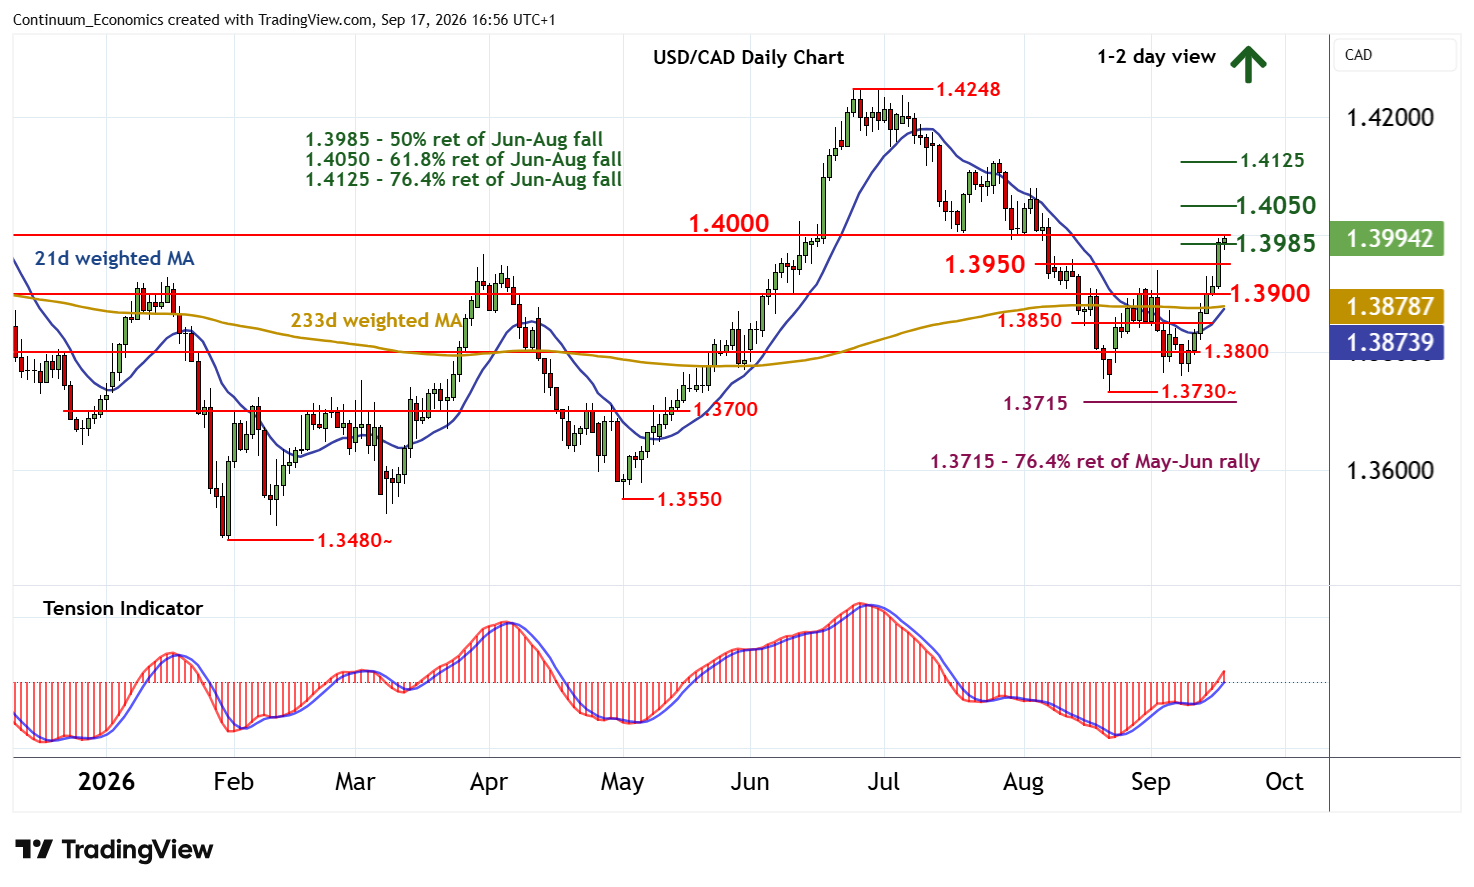
| Levels | Imp | Comment | Levels | Imp | Comment | |||
|---|---|---|---|---|---|---|---|---|
| R4 | 1.4125 | ** | 76.4% ret of Jun-Aug fall | S1 | 1.3950 | congestion | ||
| R3 | 1.4050 | ** | 61.8% ret, congestion | S2 | 1.3900 | * | congestion | |
| R2 | 1.4000 | ** | break level | S3 | 1.3850 | congestion | ||
| R1 | 1.3985 | ** | 50% ret of Jun-Aug fall | S4 | 1.3800 | ** | congestion |
Asterisk denotes strength of level
16:30 BST - Anticipated gains have reached resistance at the 1.3985 Fibonacci retracement and the 1.4000 break level, where deteriorating intraday studies and flattening overbought daily stochastics are prompting consolidation. The daily Tension Indicator continues to rise, however, and broader weekly charts are rising, pointing to room for still further gains in the coming sessions. A close above here will extend late-August gains towards resistance at 1.4050, where fresh profit-taking/consolidation could develop.
Meanwhile, support is raised to congestion around 1.3950. A close beneath here, if seen, will stabilise sentiment and prompt consolidation above further congestion around 1.3900.