Published: 2026-06-23T01:58:31.000Z
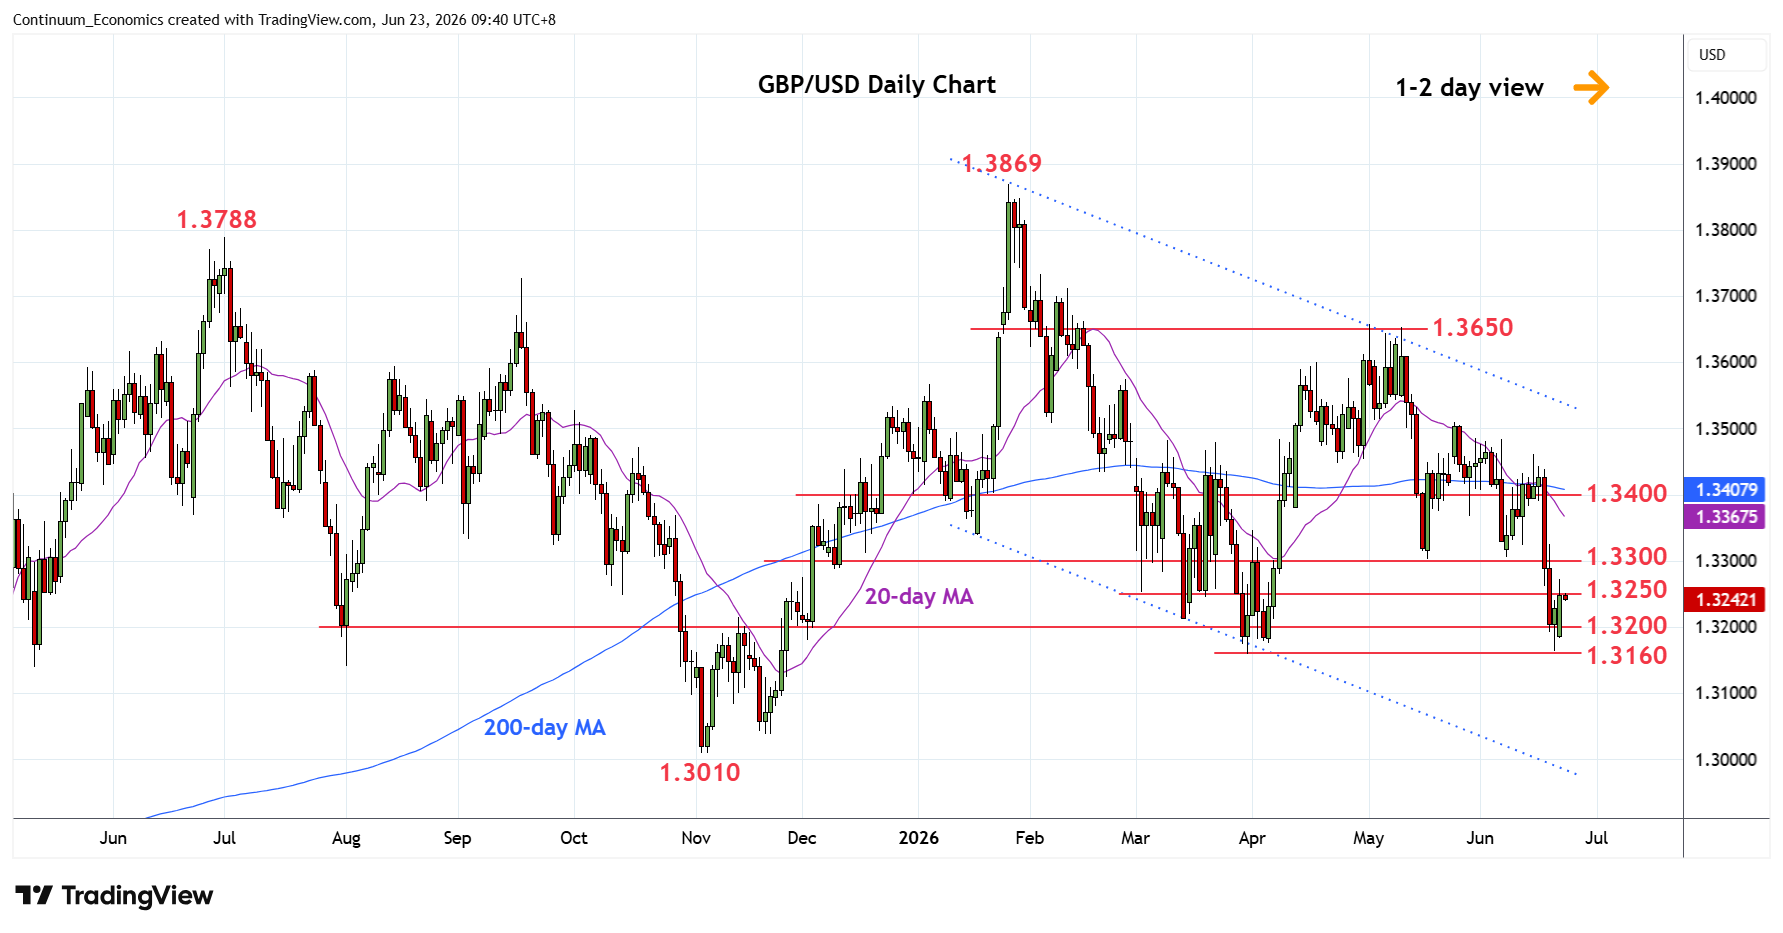
Chart GBP/USD Update: Turned up from retest of 1.3160 March YTD low
-
Extend bounce from retest of the 1.3160 March current year low as prices consolidate sharp losses last week
| Level | Comment | Level | Comment | |||||
|---|---|---|---|---|---|---|---|---|
| R4 | 1.3400 | * | congestion | S1 | 1.3160 | ** | 31 Mar YTD low | |
| R3 | 1.3350 | * | congestion | S2 | 1.3100 | * | congestion | |
| R2 | 1.3300 | ** | congestion, May low | S3 | 1.3038 | * | 20 Nov low | |
| R1 | 1.3250 | congestion | S4 | 1.3010 | ** | 4 Nov low |
Asterisk denotes strength of level
01:50 GMT - Extend bounce from retest of the 1.3160 March current year low as prices consolidate sharp losses last week. Daily studies have turned up from oversold area as well and suggest scope for test higher towards resistance at 1.3250/1.3300 congestion and May low. Would need to regain the latter to fade the downside pressure and open up room for stronger recovery to 1.3350/1.3400 area. Meanwhile, support at the 1.3160 low should underpin. Failure, will extend the January losses and see room to the 1.3100 initially.