Published: 2026-07-01T00:45:22.000Z
Chart NZD/USD Update: Extending bounce from .5625 current year low
1
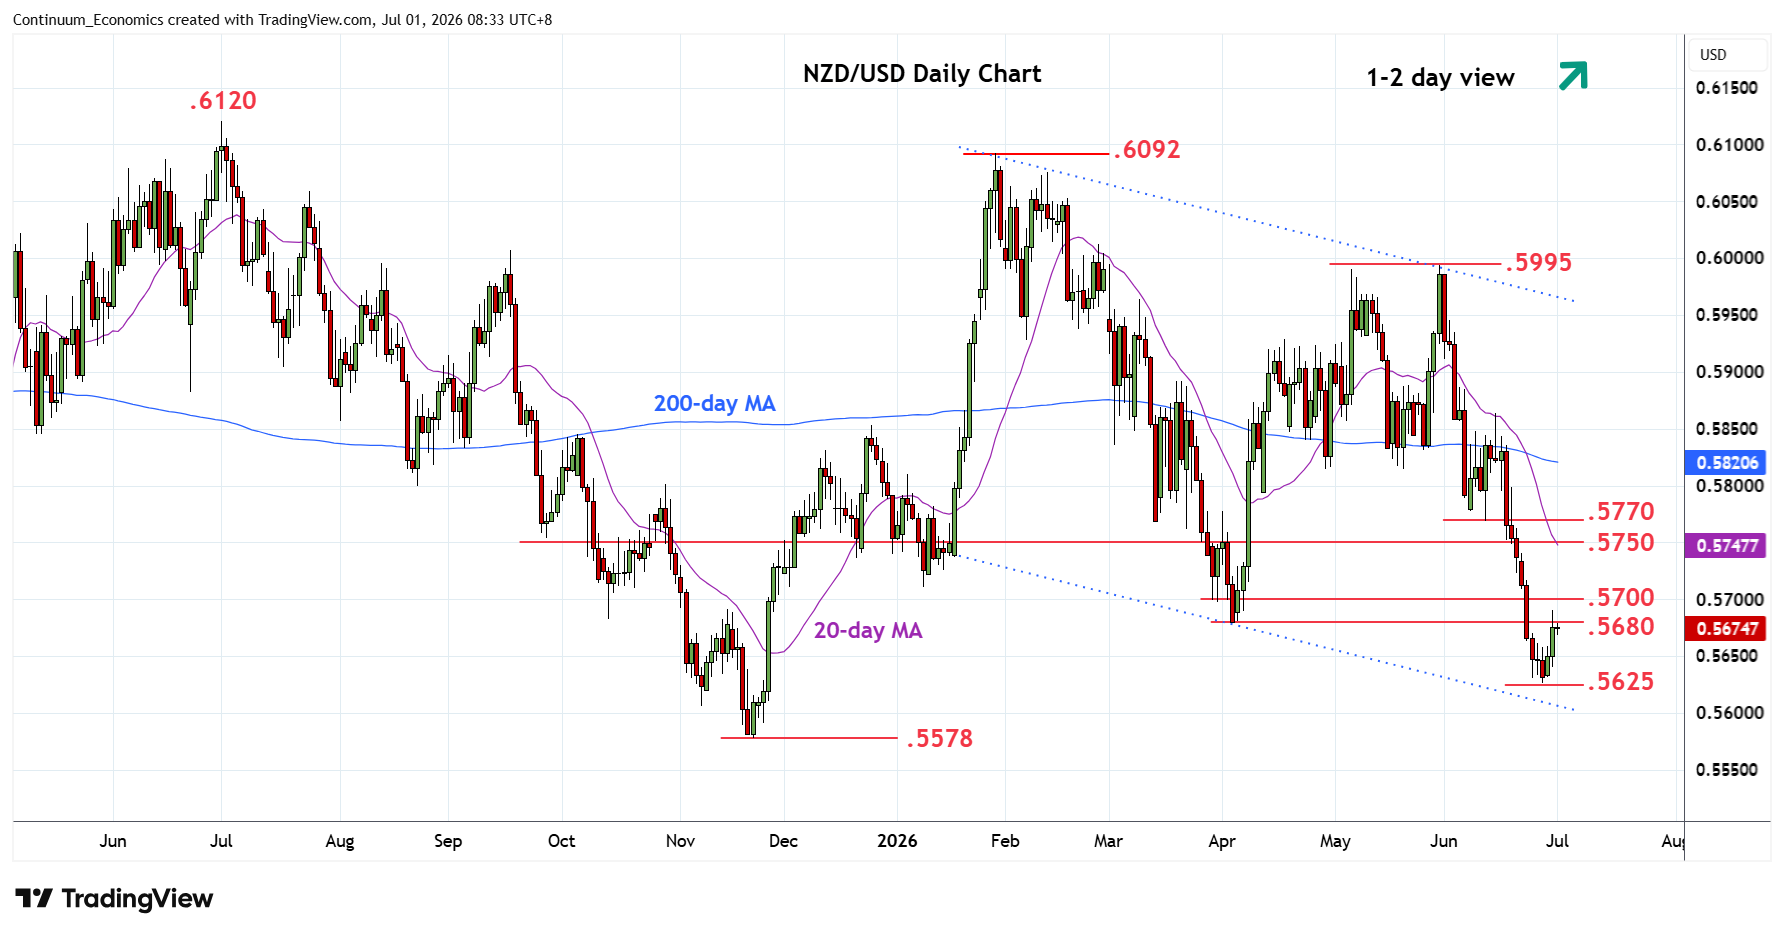
Consolidation at the 26 June current year low at .5625 has given way to bounce as prices unwind oversold daily studies
| Levels | Imp | Comment | Levels | Imp | Comment | |||
|---|---|---|---|---|---|---|---|---|
| R4 | .5770/80 | ** | 11, 8 Jun lows | S1 | .5625 | ** | 26 Jun YTD low | |
| R3 | .5750 | * | congestion | S2 | .5610/00 | * | channel, congestion | |
| R2 | .5700 | * | congestion | S3 | .5578 | ** | Nov low | |
| R1 | .5680 | ** | Apr low | S4 | .5550 | congestion |
Asterisk denotes strength of level
00:35 GMT - Consolidation at the 26 June current year low at .5625 has given way to bounce as prices unwind oversold daily studies. Gains see prices retracing losses from the May high to reach strong resistance at the .5680/.5700 April low and congestion area. Above here will open up room for stronger recovery to the .5750 congestion then the .5770/80, previous 11 and 8 June lows. Meanwhile, support at the .5650/25 area should now underpin. Failure here, will further extend the January losses and see room to .5600 level and .5578, November low.