Chart AUD/USD Update: Break to fresh year low
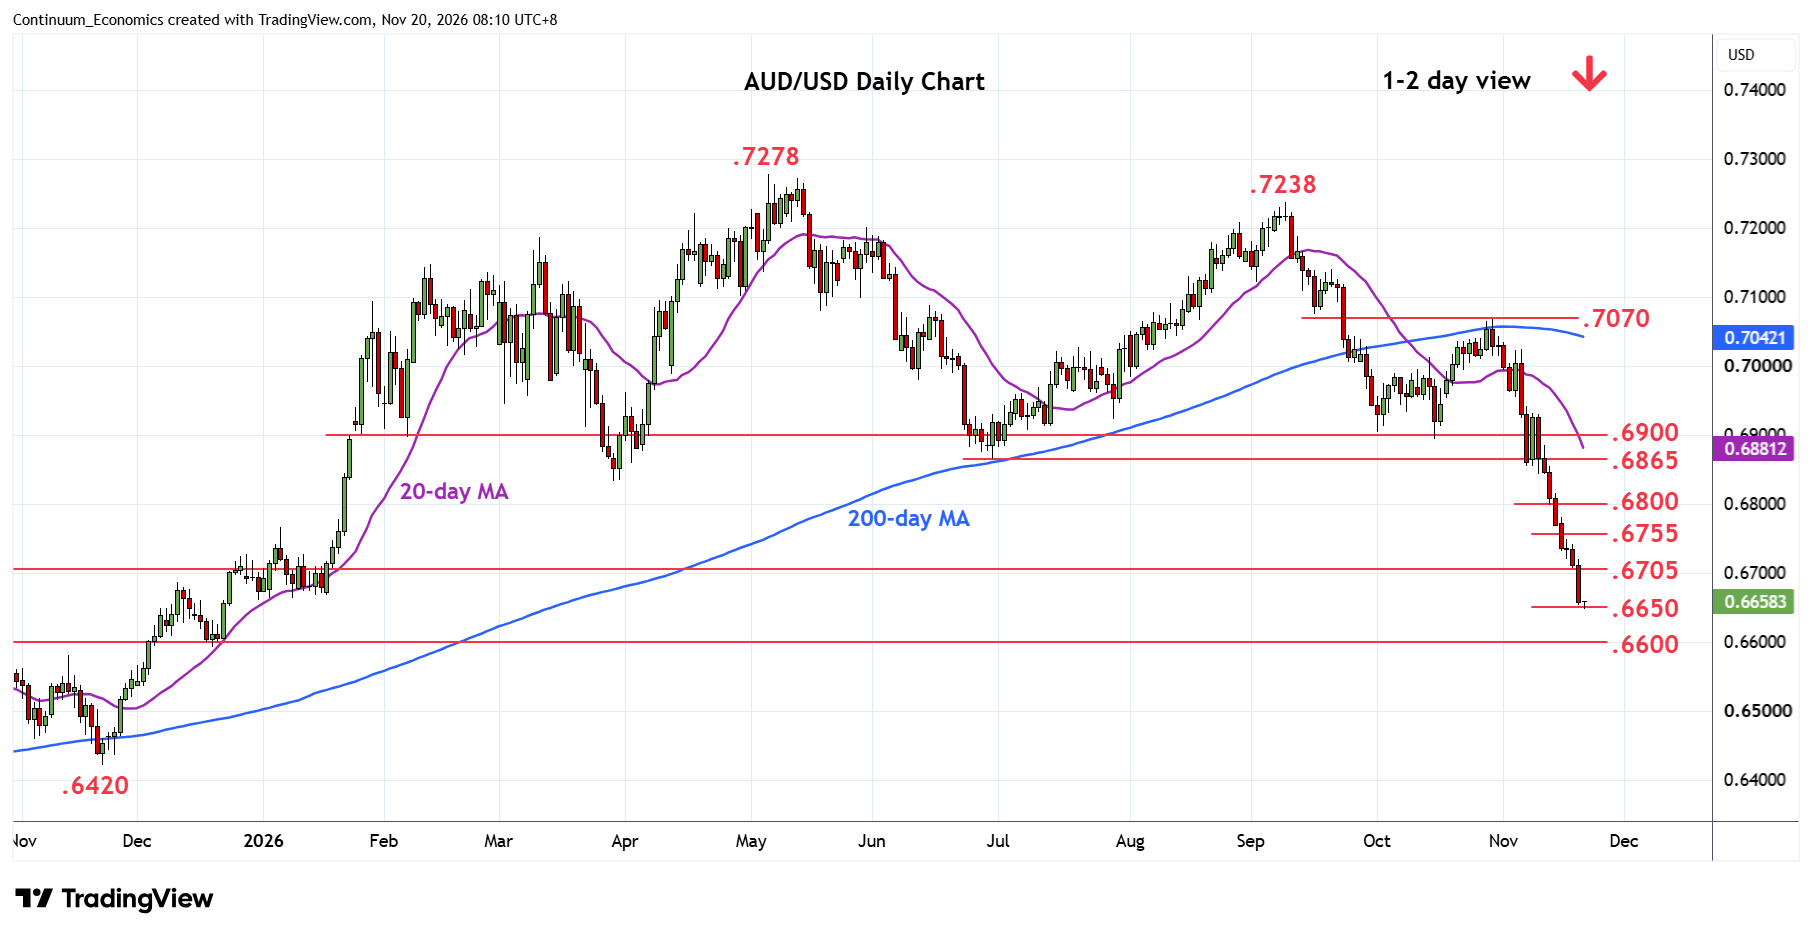
Test of the .6663 January low has given way to break to reach fresh year low at .6650 congestion
| Levels | Imp | Comment | Levels | Imp | Comment | |||
|---|---|---|---|---|---|---|---|---|
| R4 | 0.6900 | ** | congestion, Oct low | S1 | 0.6650 | * | congestion | |
| R3 | 0.6865 | ** | Jun low | S2 | 0.6600 | ** | congestion, 50% | |
| R2 | 0.6755/00 | * | congestion | S3 | 0.6550 | * | congestion | |
| R1 | 0.6700/05 | * | congestion, Sep 2025 high | S4 | 0.6500 | * | congestion, h&s objective |
Asterisk denotes strength of level
00:15 GMT - Test of the .6663 January low has given way to break to reach fresh year low at .6650 congestion. Oversold intraday and daily studies suggest scope for pause here but bearish momentum should limit any bounce attempt. Lower will see room to the .6600, figure and 50% Fibonacci retracement. Lower still, if seen, will see scope to .6500, objective of the 10-month top pattern following break of the .6900 level in early-November. Meanwhile, resistance is lowered to .6700/05 congestion and September 2025 high. Would need lift over here to open up room for stronger corrective bounce of the steep drop from .7070, October high.