Published: 2026-09-17T01:46:18.000Z
Chart EUR/USD Update: Extending losses
1
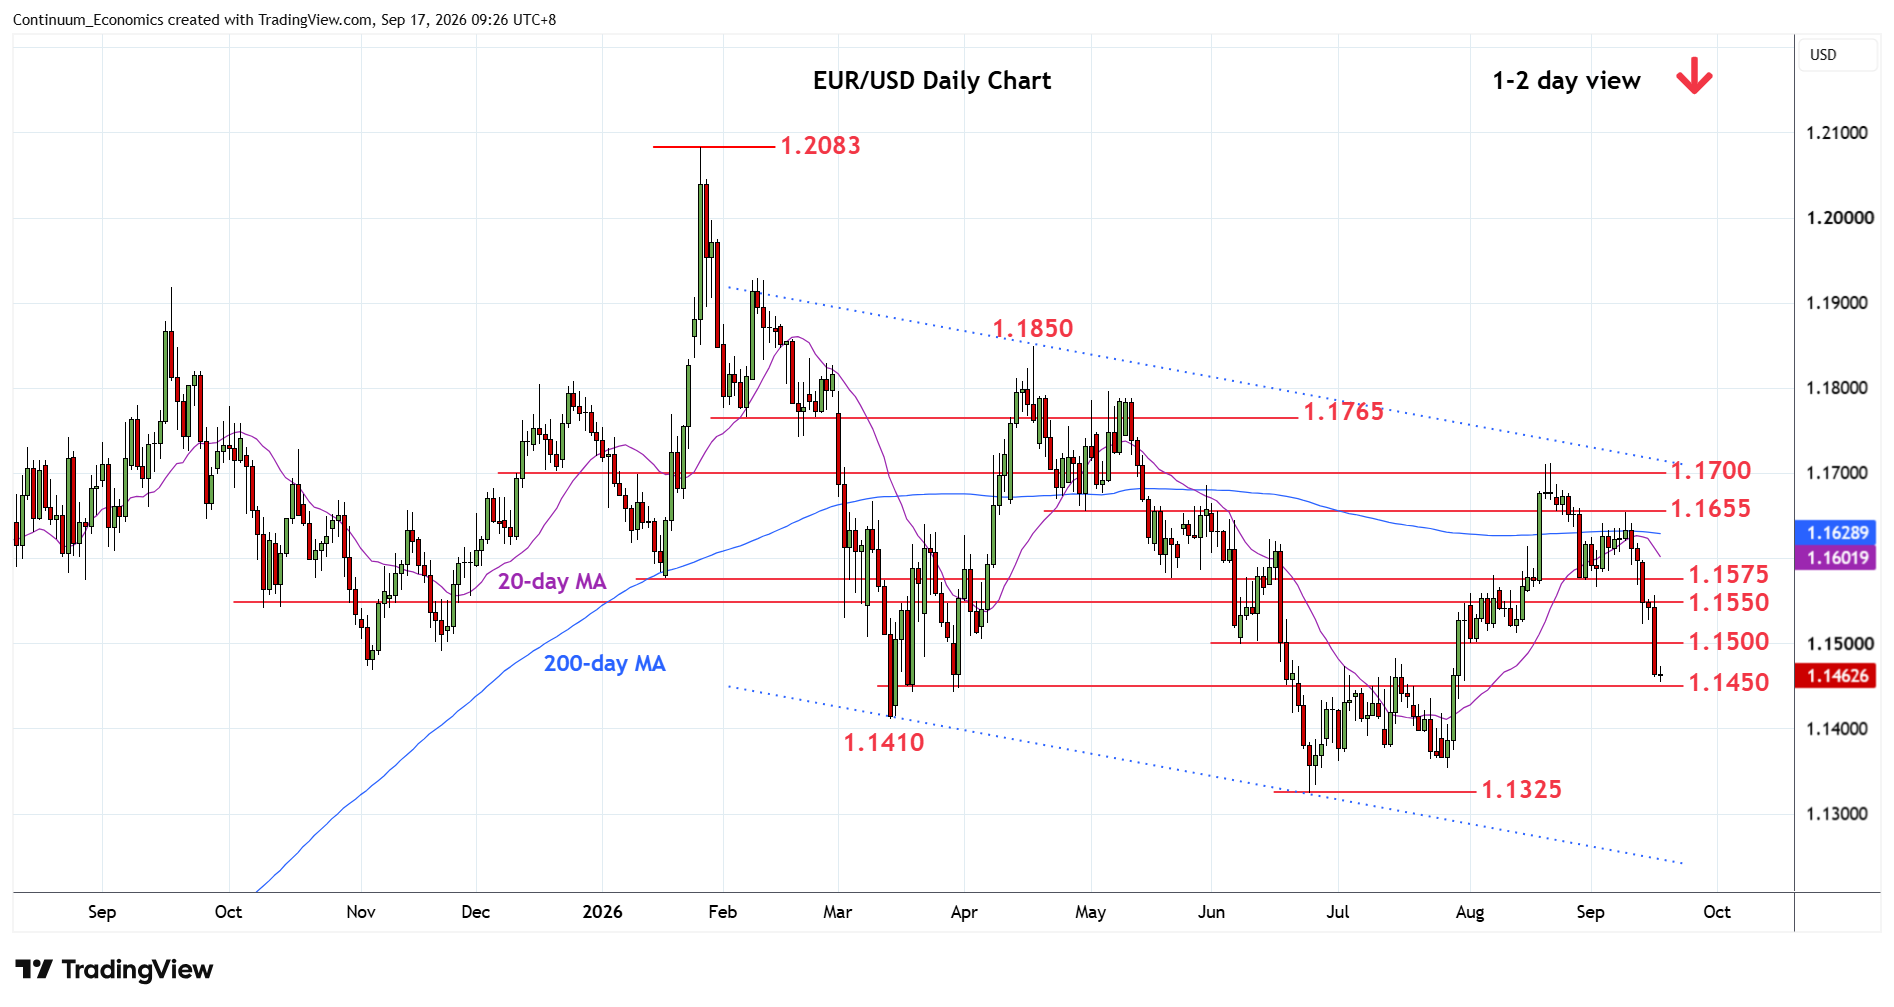
Consolidation above the 1.1523 low of Monday has given way to break to extend losses from the 1.1655 high of last week
| Levels | Imp | Comment | Levels | Imp | Comment | |||
|---|---|---|---|---|---|---|---|---|
| R4 | 1.1655 | ** | 30 Apr low | S1 | 1.1450 | * | congestion | |
| R3 | 1.1600 | * | congestion | S2 | 1.1410/00 | ** | Mar low, congestion | |
| R2 | 1.1575/50 | ** | May low, congestion | S3 | 1.1350 | * | congestion | |
| R1 | 1.1500 | * | congestion | S4 | 1.1325 | ** | 24 Jun YTD low |
Asterisk denotes strength of level
01:40 GMT - Consolidation above the 1.1523 low of Monday has given way to break to extend losses from the 1.1655 high of last week. Negative and weekly studies keep pressure on the downside and to reach towards the 1.1450 congestion. Below this will see room to retest the March low at 1.1410 where reaction can be expected. Break here, if seen, will turn focus to the July low at 1.1350 and 1.1325, June current year low. Meanwhile, resistance is lowered to 1.1500 congestion. Regaining this needed to ease the downside pressure and see room for consolidation to retest the 1.1550/75 resistance.