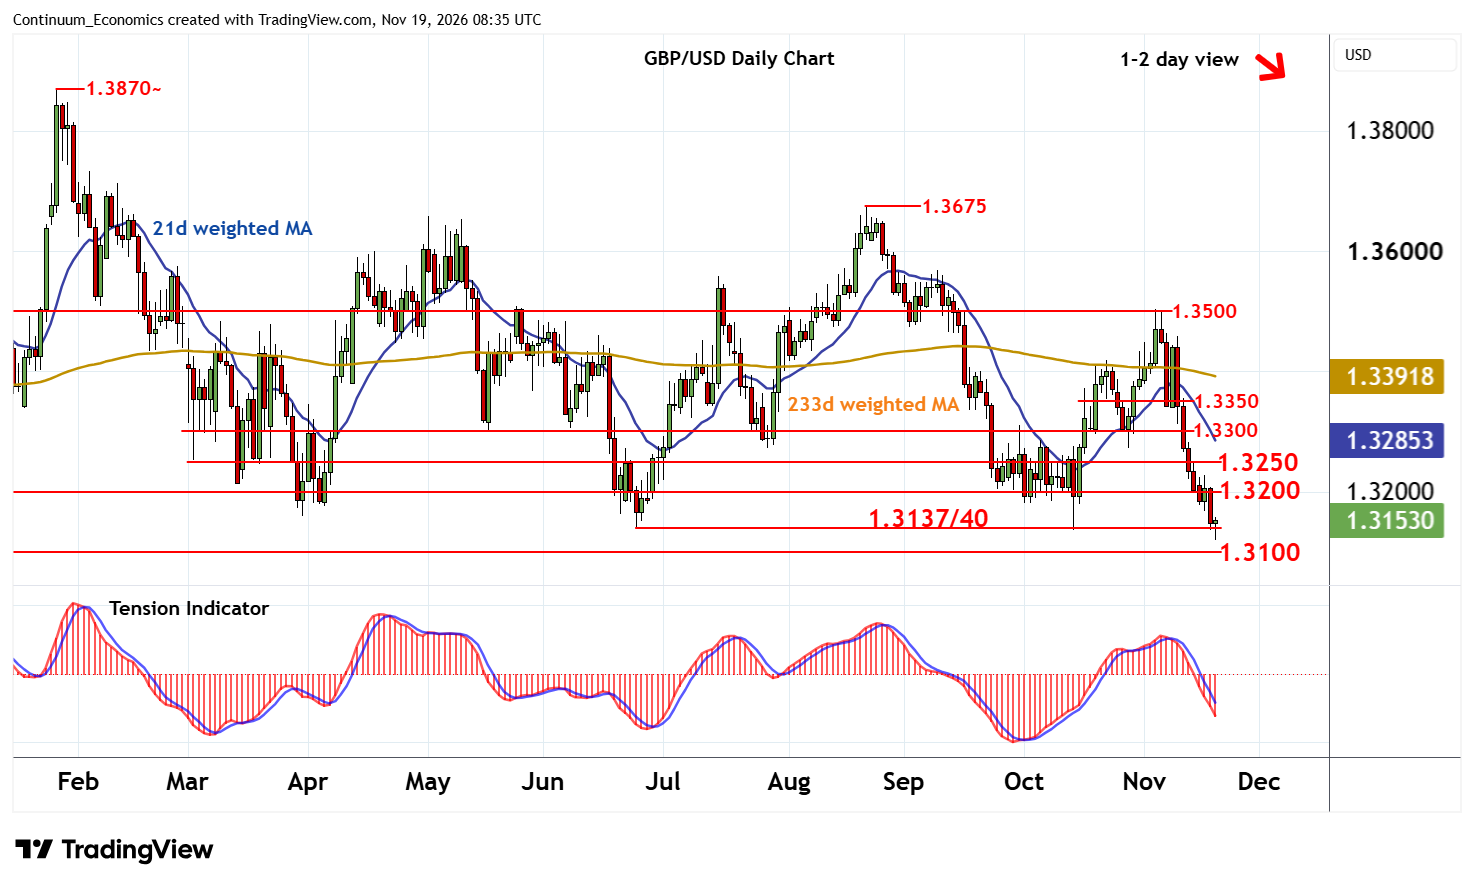
Chart GBP/USD Update: Fresh year low
The anticipated test of critical support at the 1.3137/40 monthly lows from June-October has extended to post a fresh year low at 1.3120
| Level | Comment | Level | Comment | |||||
|---|---|---|---|---|---|---|---|---|
| R4 | 1.3350 | break level | S1 | 1.3137/40 | ** | Jun-Oct (m) lows | ||
| R3 | 1.3300 | ** | congestion | S2 | 1.3120 | fresh year low | ||
| R2 | 1.3250 | * | congestion | S3 | 1.3100 | * | congestion | |
| R1 | 1.3200 | ** | congestion | S4 | 1.3035~ | * | 20 Nov 2025 (w) low |
Asterisk denotes strength of level
08:10 GMT - The anticipated test of critical support at the 1.3137/40 monthly lows from June-October has extended to post a fresh year low at 1.3120, before bouncing sharply to currently trade around 1.3155. Negative intraday studies are flattening, suggesting room for continuation towards congestion resistance at 1.3200. But mixed/negative daily readings and bearish weekly charts should prompt renewed selling interest towards here. A close above 1.3200, however, would help to stabilise price action and prompt consolidation beneath further congestion around 1.3250.
Following cautious/corrective trade, fresh losses are looked for. A later close below 1.3137/40 will add weight to already bearish price action and extend losses from the 1.3870 current year high of 27 January below congestion around 1.3100 towards critical support around 1.3000/10.