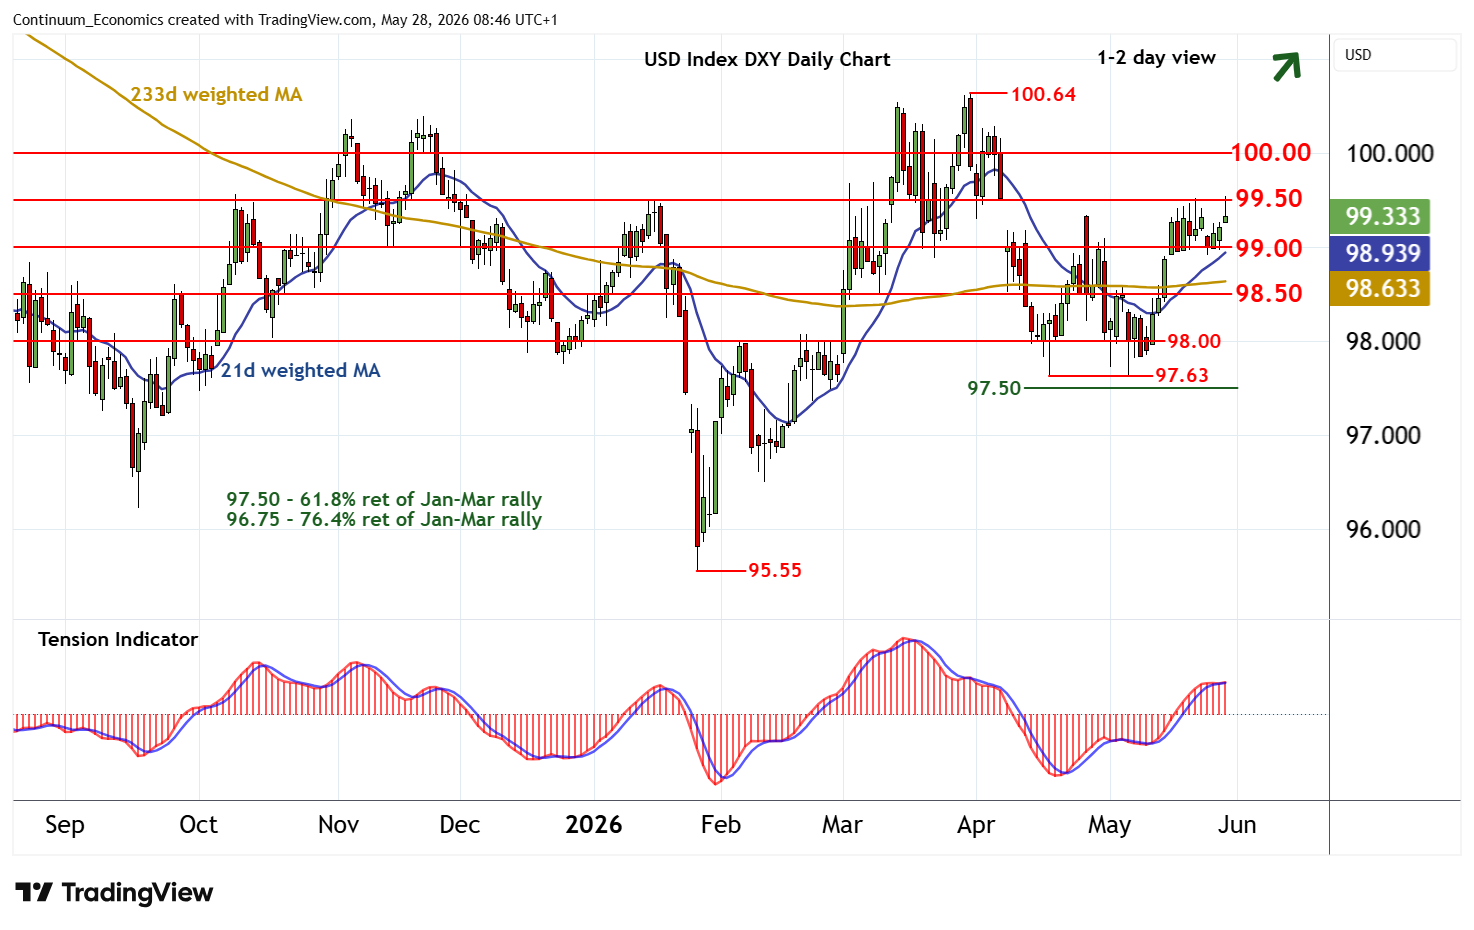
Chart USD Index DXY Update: Higher in range - studies improving
Cautious trade above congestion support at 99.00 has given way to a bounce
| Levels | Imp | Comment | Levels | Imp | Comment | |||
|---|---|---|---|---|---|---|---|---|
| R4 | 100.64 | ** | 31 Mar YTD high | S1 | 99.00 | * | congestion | |
| R3 | 100.29 | * | 6 Apr (m) high | S2 | 98.50 | * | congestion | |
| R2 | 100.00 | ** | congestion | S3 | 98.00 | * | congestion | |
| R1 | 99.50 | * | congestion, gap high | S4 | 97.63 | ** | 17 Apr (m) low |
Asterisk denotes strength of level
08:35 BST - Cautious trade above congestion support at 99.00 has given way to a bounce, with prices reaching resistance at 99.50 before settling into consolidation around 99.35. Daily readings are improving and broader weekly charts are mixed/positive, highlighting room for further strength in the coming sessions. A break above 99.50 will improve sentiment and open up congestion around 100.00. But already overbought daily stochastics could limit any initial tests in profit-taking/consolidation. Meanwhile, a close below 99.00, if seen, would add weight to sentiment and extend losses towards further congestion around 98.50, where rising studies could prompt renewed buying interest/consolidation.