Published: 2026-11-20T01:18:59.000Z
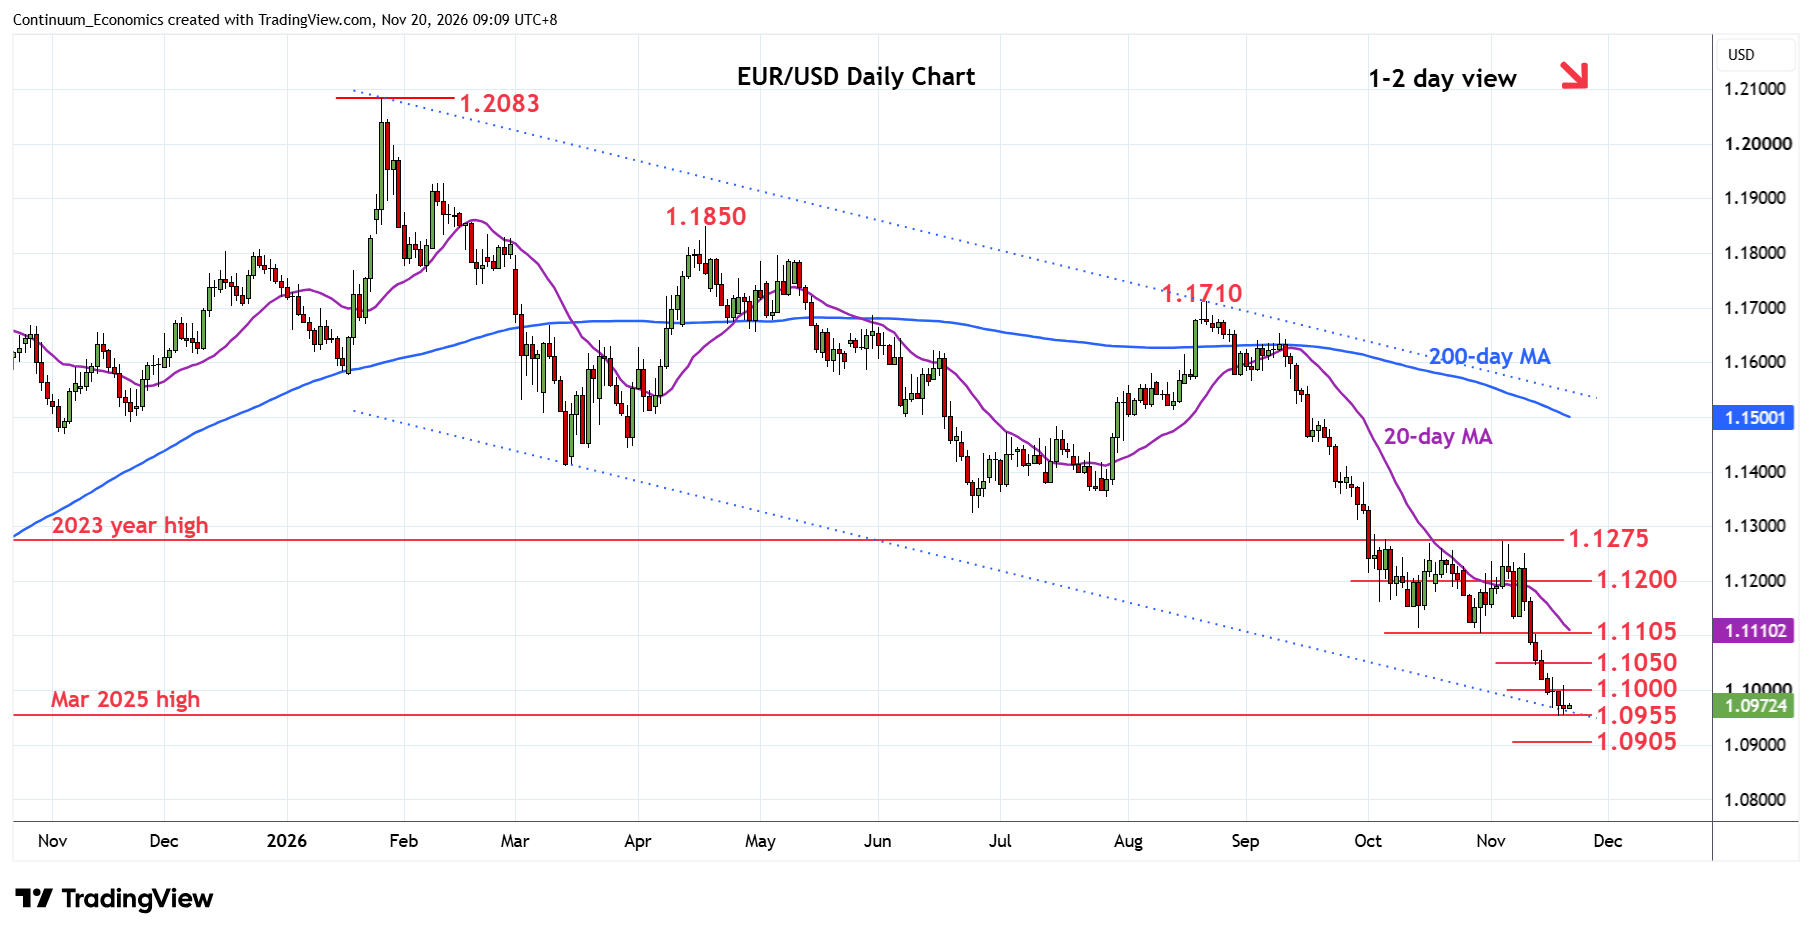
Chart EUR/USD Update: Consolidating at 1.0953 current year low
1
Extending consolidation at the 1.0955/53 support and mid-week current year low
| Levels | Imp | Comment | Levels | Imp | Comment | |||
|---|---|---|---|---|---|---|---|---|
| R4 | 1.1150 | * | congestion | S1 | 1.0955/53 | * | Mar 2025 high, 18 Nov YTD low | |
| R3 | 1.1105 | ** | Oct low | S2 | 1.0905 | * | 61.8% 2025/2026 rally | |
| R2 | 1.1050 | congestion | S3 | 1.0850 | * | congestion | ||
| R1 | 1.1000 | * | figure, congestion | S4 | 1.0800 | * | congestion |
Asterisk denotes strength of level
01:15 GMT - Extending consolidation at the 1.0955/53 support and mid-week current year low. Daily studies are mixed at oversold areas but further losses cannot be ruled out to extend losses from the 1.1710 August swing high. Break, if seen, will further retrace the 2025/2026 rally to target 1.0905, 61.8% Fibonacci retracement. Meanwhile, resistance remains at the 1.1000 level. Would need lift over this to ease the downside pressure and see room for stronger bounce to the 1.1050 congestion then 1.1105 low of October. Would expect the latter to cap and sustain losses from the 1.1275 resistance.