Published: 2026-11-09T08:39:04.000Z
Chart EUR/USD Update: Choppy in broad range
1
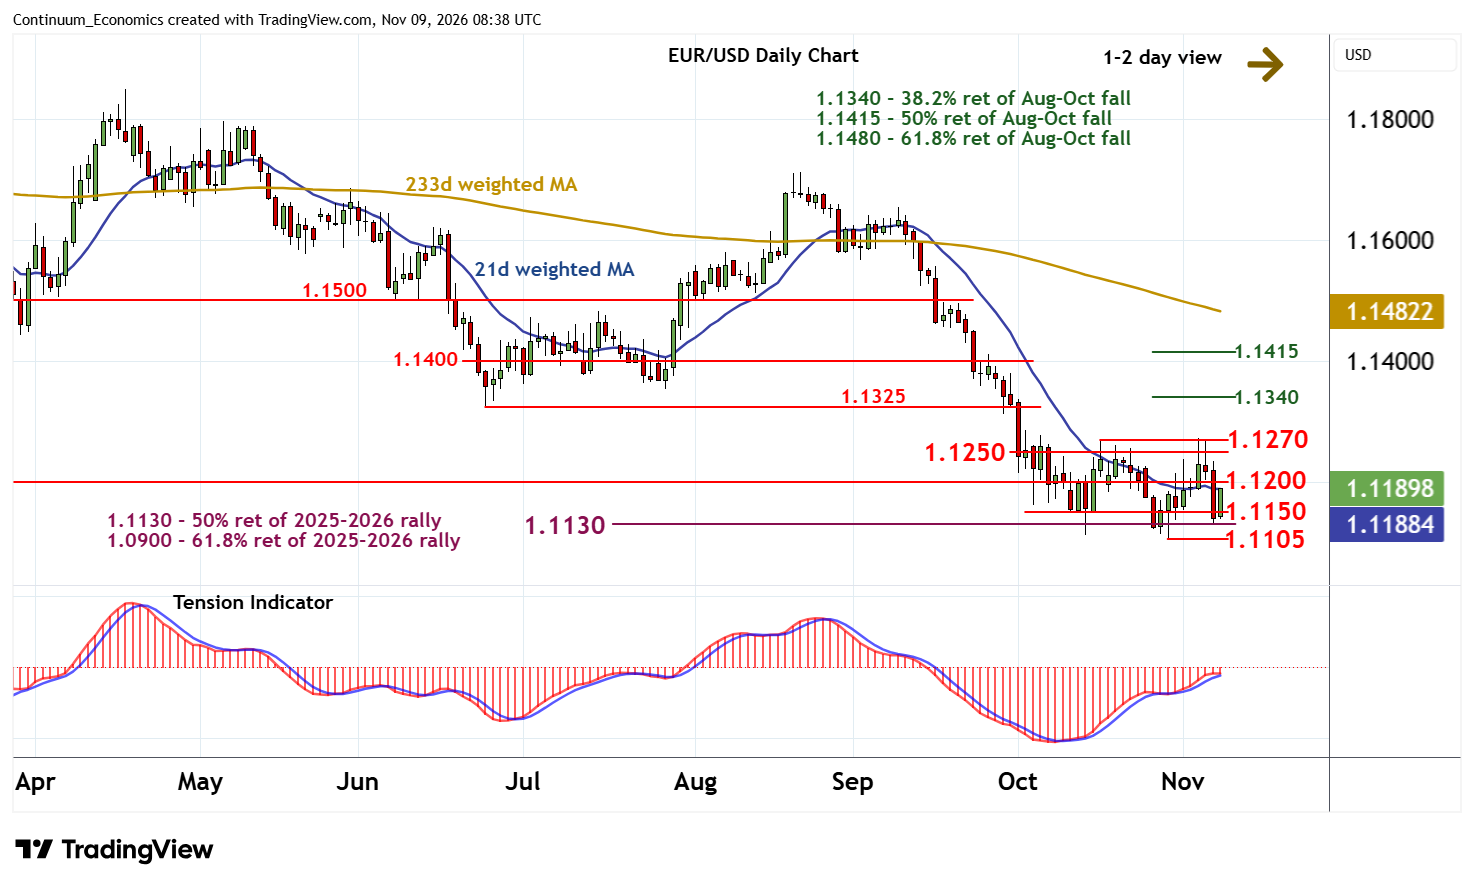
Anticipated losses have tested below congestion support at 1.1150 to reach the 1.1130 Fibonacci retracement
| Levels | Imp | Comment | Levels | Imp | Comment | |||
|---|---|---|---|---|---|---|---|---|
| R4 | 1.1325/40 | ** | 24 Jun (m) low; 38.2% ret | S1 | 1.1150 | congestion | ||
| R3 | 1.1270 | ** | 16 Oct (w) high | S2 | 1.1130 | ** | 50% ret of 2025-2026 rally | |
| R2 | 1.1250 | congestion tops | S3 | 1.1100/05 | ** | congestion; 29 Oct YTD low | ||
| R1 | 1.1200 | ** | break level | S4 | 1.11.1065 | ** | 12 May 2025 (m) low |
*Asterisk denotes strength of level
08:30 GMT - Anticipated losses have tested below congestion support at 1.1150 to reach the 1.1130 Fibonacci retracement. Unwinding oversold intraday studies are prompting a sharp bounce from here towards resistance at 1.1200. A test above here cannot be ruled out. But mixed/negative daily readings should limit any break in renewed selling interest/consolidation beneath the 1.1250 congestion tops.
Meanwhile, support remains at 1.1130/50. But mixed weekly charts should limit any immediate tests beneath here in consolidation above critical support at the 1.1105 current year low of 29 October..