Published: 2026-07-13T07:15:22.000Z
Chart USD/CHF Update: Turned up from .8010 support
4
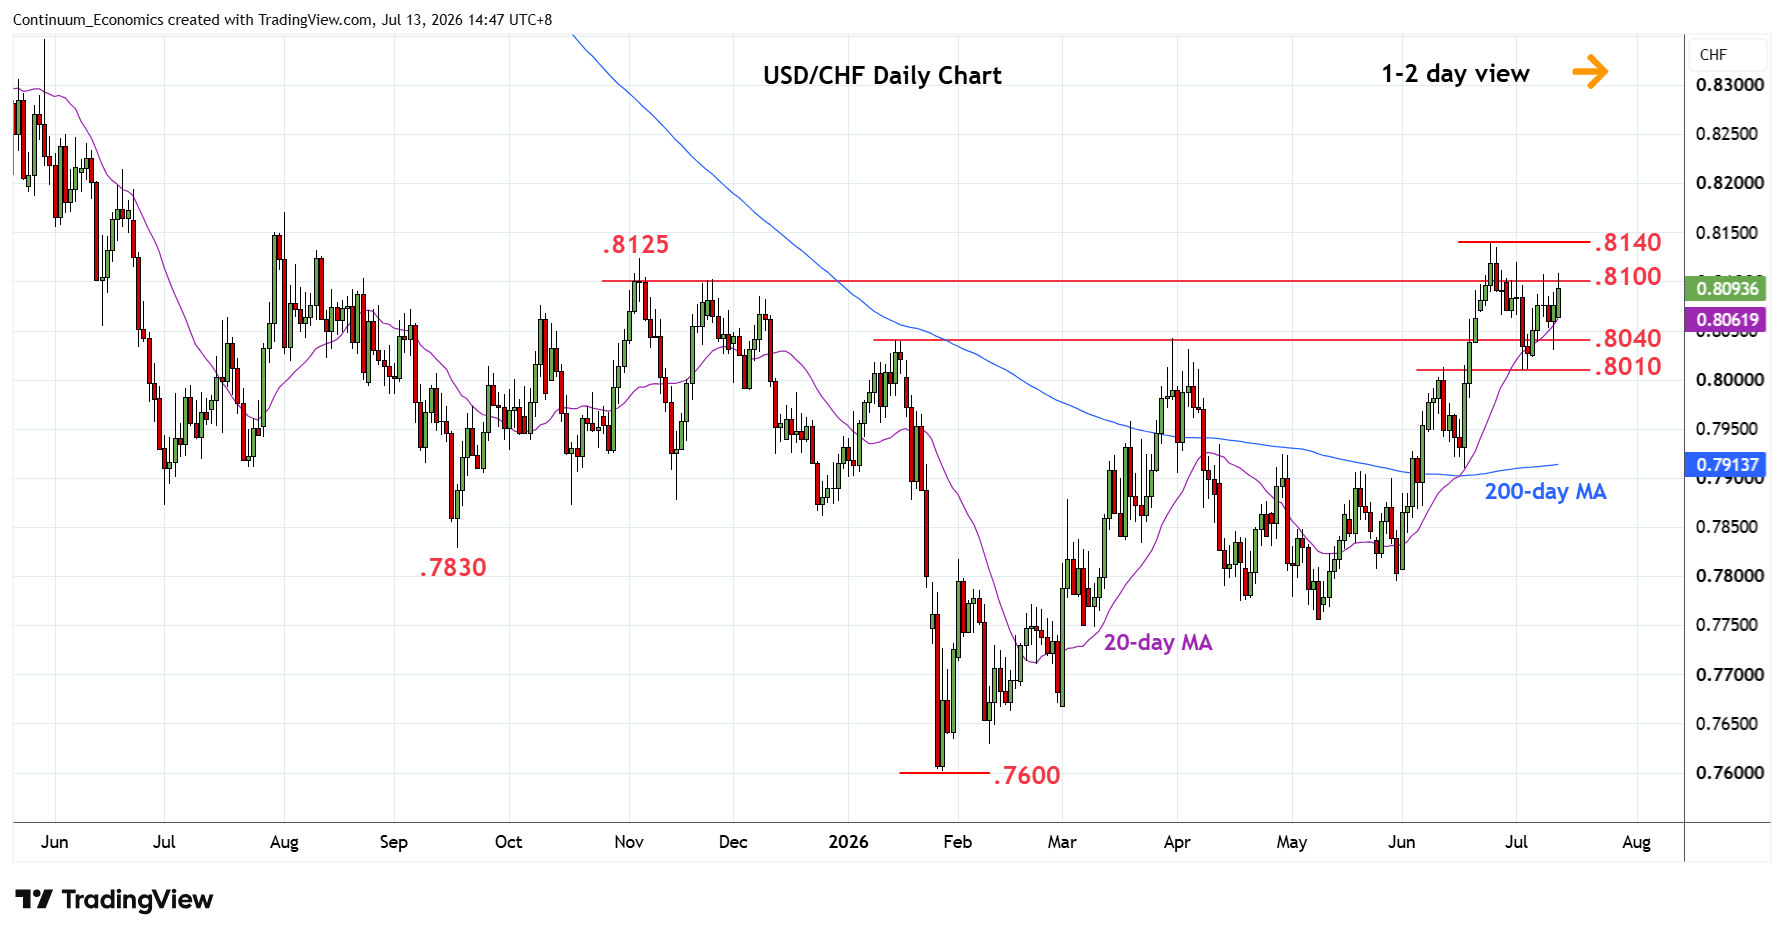
Return to pressure the .8100 level following bounce from support the .8010
| Level | Comment | Level | Comment | |||||
|---|---|---|---|---|---|---|---|---|
| R4 | 0.8170 | * | Aug high | S1 | 0.8040 | ** | Jan/Mar highs | |
| R3 | 0.8140 | ** | 24 Jun YTD high | S2 | 0.8010 | ** | 2 Jul low | |
| R2 | 0.8125 | * | Nov high | S3 | 0.7950 | * | congestion | |
| R1 | 0.8100 | * | congestion | S4 | 0.7910/00 | * | 17 Jun low, congestion |
Asterisk denotes strength of level
07:10 GMT - Return to pressure the .8100 level following bounce from support the .8010. Break here will clear the way for retest of the .8125/40, November high and June current year high. Clearance here will see room for stronger gains to retrace the 2025/2026 losses to .8210, 38.2% Fibonacci retracement. Meanwhile, support is at .8040 January/March and this extend to the .8010 low of 2 July. Would take break of these to open up room for deeper pullback to unwind overbought weekly studies and see deeper pullback to support at .7950 and .7910/00 congestion area.