Published: 2026-10-05T00:28:02.000Z
Chart AUD/USD Update: Higher in consolidation from .6900
4
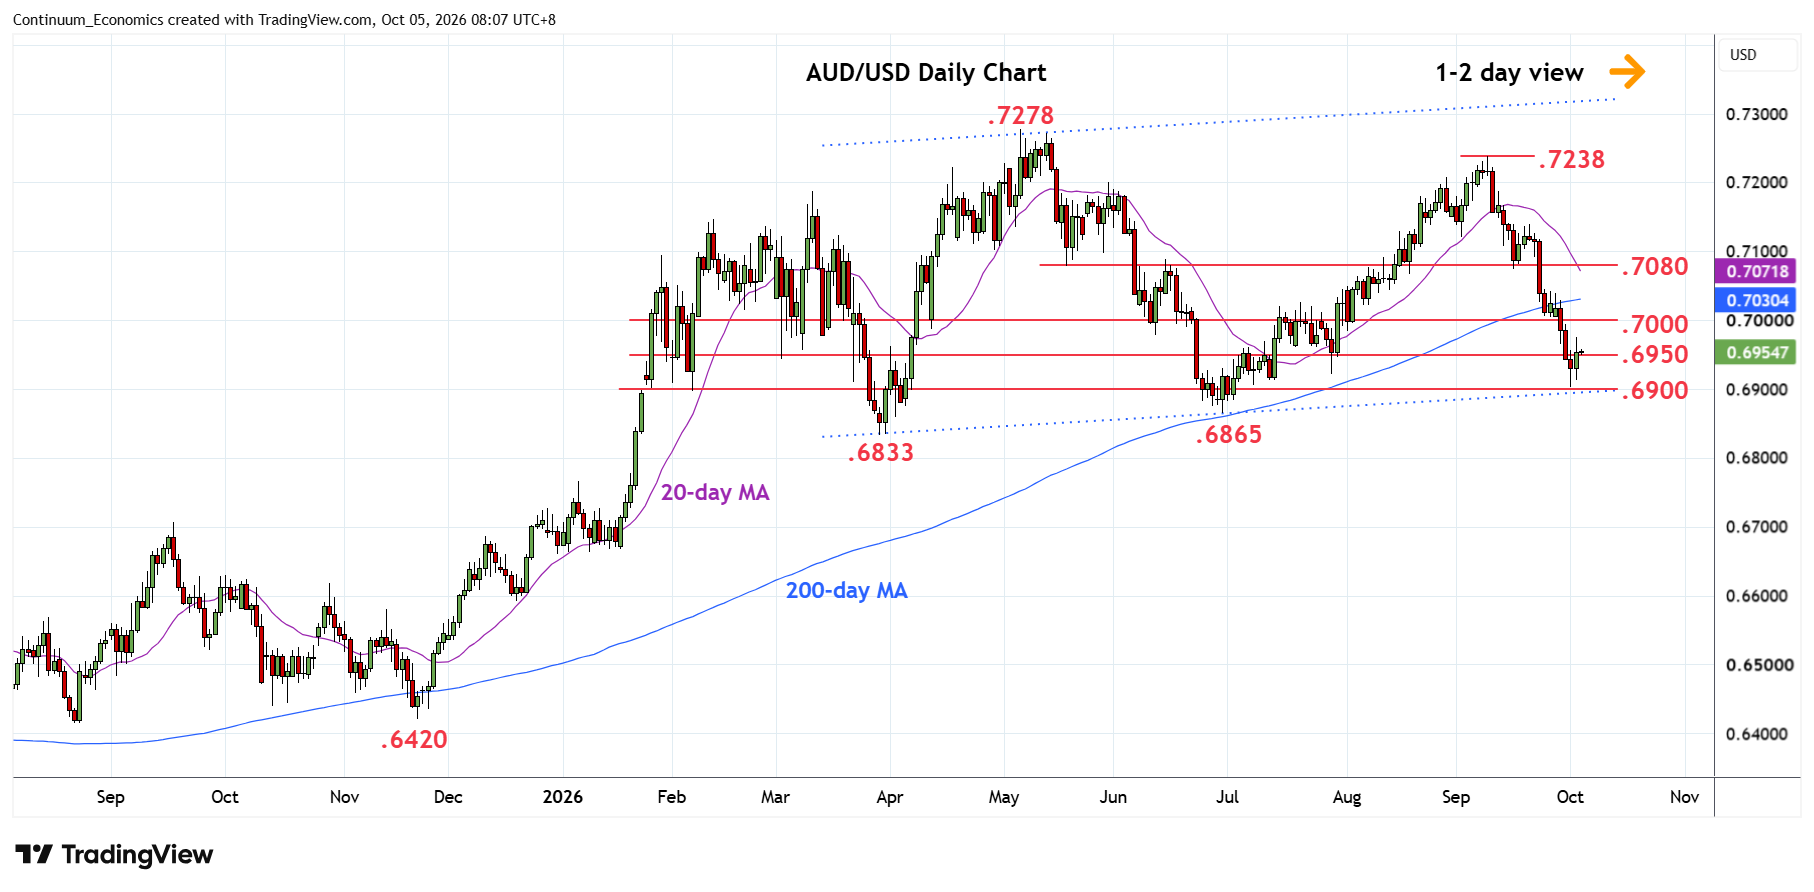
Consolidating above .6950 congestion following bounce from support at the .6900 level and 5-month channel from March low
| Levels | Imp | Comment | Levels | Imp | Comment | |||
|---|---|---|---|---|---|---|---|---|
| R4 | 0.7100 | ** | congestion | S1 | 0.6950 | * | congestion | |
| R3 | 0.7075 | * | 16 Sep low | S2 | 0.6900 | ** | congestion, channel | |
| R2 | 0.7050 | * | congestion | S3 | 0.6865 | ** | Jun low | |
| R1 | 0.7000 | * | congestion | S4 | 0.6833 | ** | Mar low |
Asterisk denotes strength of level
00:15 GMT - Consolidating above .6950 congestion following bounce from support at the .6900 level and 5-month channel from March low. Daily studies are unwinding oversold readings and suggest scope to resistance at the .7000/.7050 congestion area which is expected to cap. Break here if seen will open up room to strong resistance at the .7075/.7100 area. Lower high sought to further pressure the downside later. Break of support at the .6950/.6900 area will extend losses from the .7238 September high to retest the .6865/.6833, June and March lows.